Why Should the Retention Factor
(Capacity Factor) Be Greater Than 2?
We saw this question on an online forum and thought it was a great question that needed a good answer.
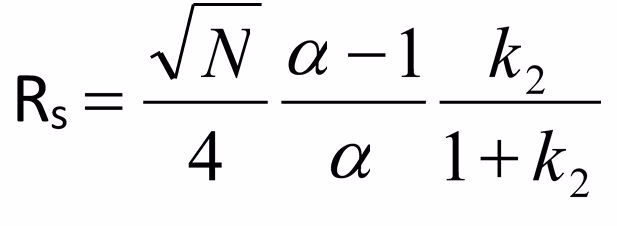
First, let's be sure we are talking about the same thing. The retention factor, k, is defined as:
|
|
You can see that this is a mass distribution constant, measuring the mass in each phase (S=stationary, M=mobile). A larger number means more of the compound on the column and larger retention times. Note that some older references refer to this as "capacity factor" with the symbol k'. The two terms mean the same thing.
The retention factor appears in the expanded resolution equation, and that is where we need to focus our attention.
Each of these terms contributes to the resolution, and each can be adjusted to improve the resolution. This chart gives you a summary of how to use these terms.
|
Parameter
|
What it Means
|
How Do We Use It to Increase Resolution?
|
|
Efficiency (N)
|
Separating ability of the column
|
Use a longer column.
|
|
Selectivity (α)
|
The “chemistry” of the system
|
Use a different column or different components in the mobile phase.
|
|
Retention (k)
|
How long is the analyte on the stationary phase?
|
Adjust operating conditions using a weaker mobile phase.
|
|
|
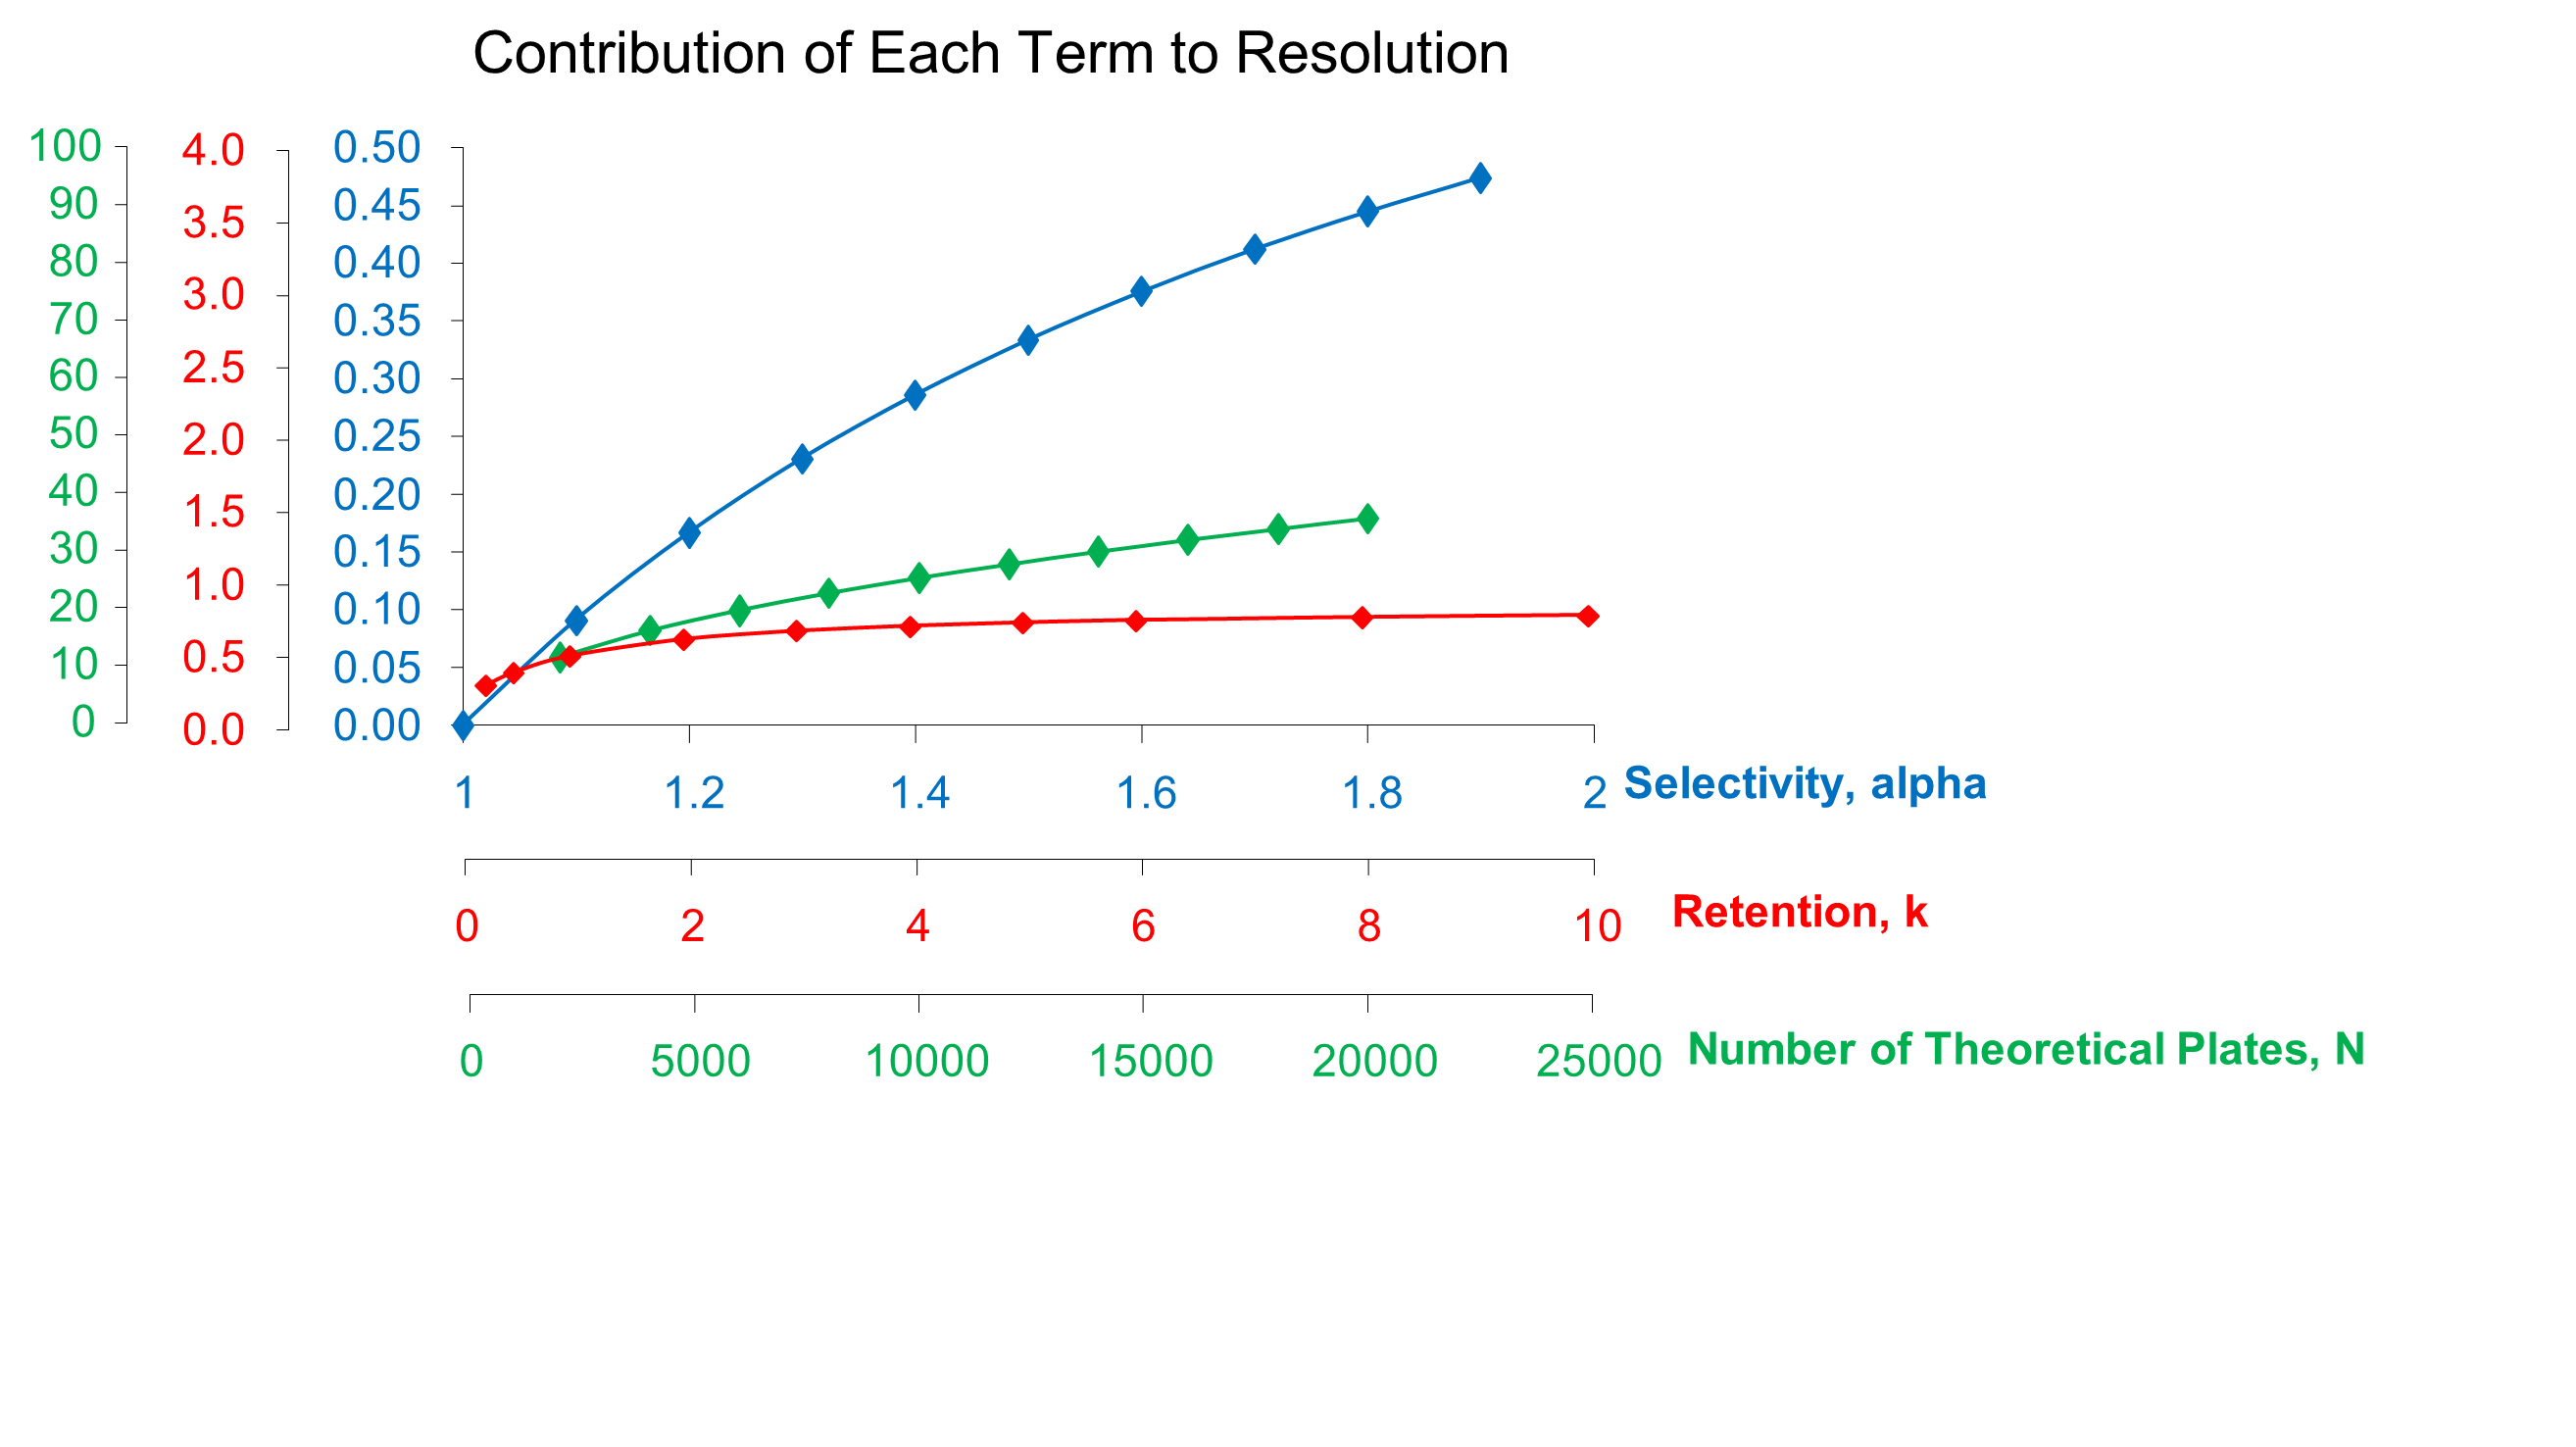
The relative contribution of each term is displayed in the following figure. To properly interpret this plot, note the differences in the x-axis scales for each parameter. You can see that changing selectivity produces a large change in resolution with only a two-fold increase in the parameter. Retention and efficiency both produce smaller increases over a factor of ten increase in either value. Therefore, the most efficient procedure for improving resolution is through a change in selectivity.
|
Parameter (in order of decreasing importance)
|
Advantage
|
Disadvantage
|
|
Selectivity (α)
|
Can produce significant improvements.
|
Requires use of different mobile phases or different columns.
|
|
Retention (k)
|
Easy to change operating parameters.
|
Only significant if retention is low. Not useful at higher k values
|
|
Efficiency (N)
|
Retains existing selectivity and elution order with better resolution.
|
Requires purchase of new column. Pressure and retention times increase.
|
.
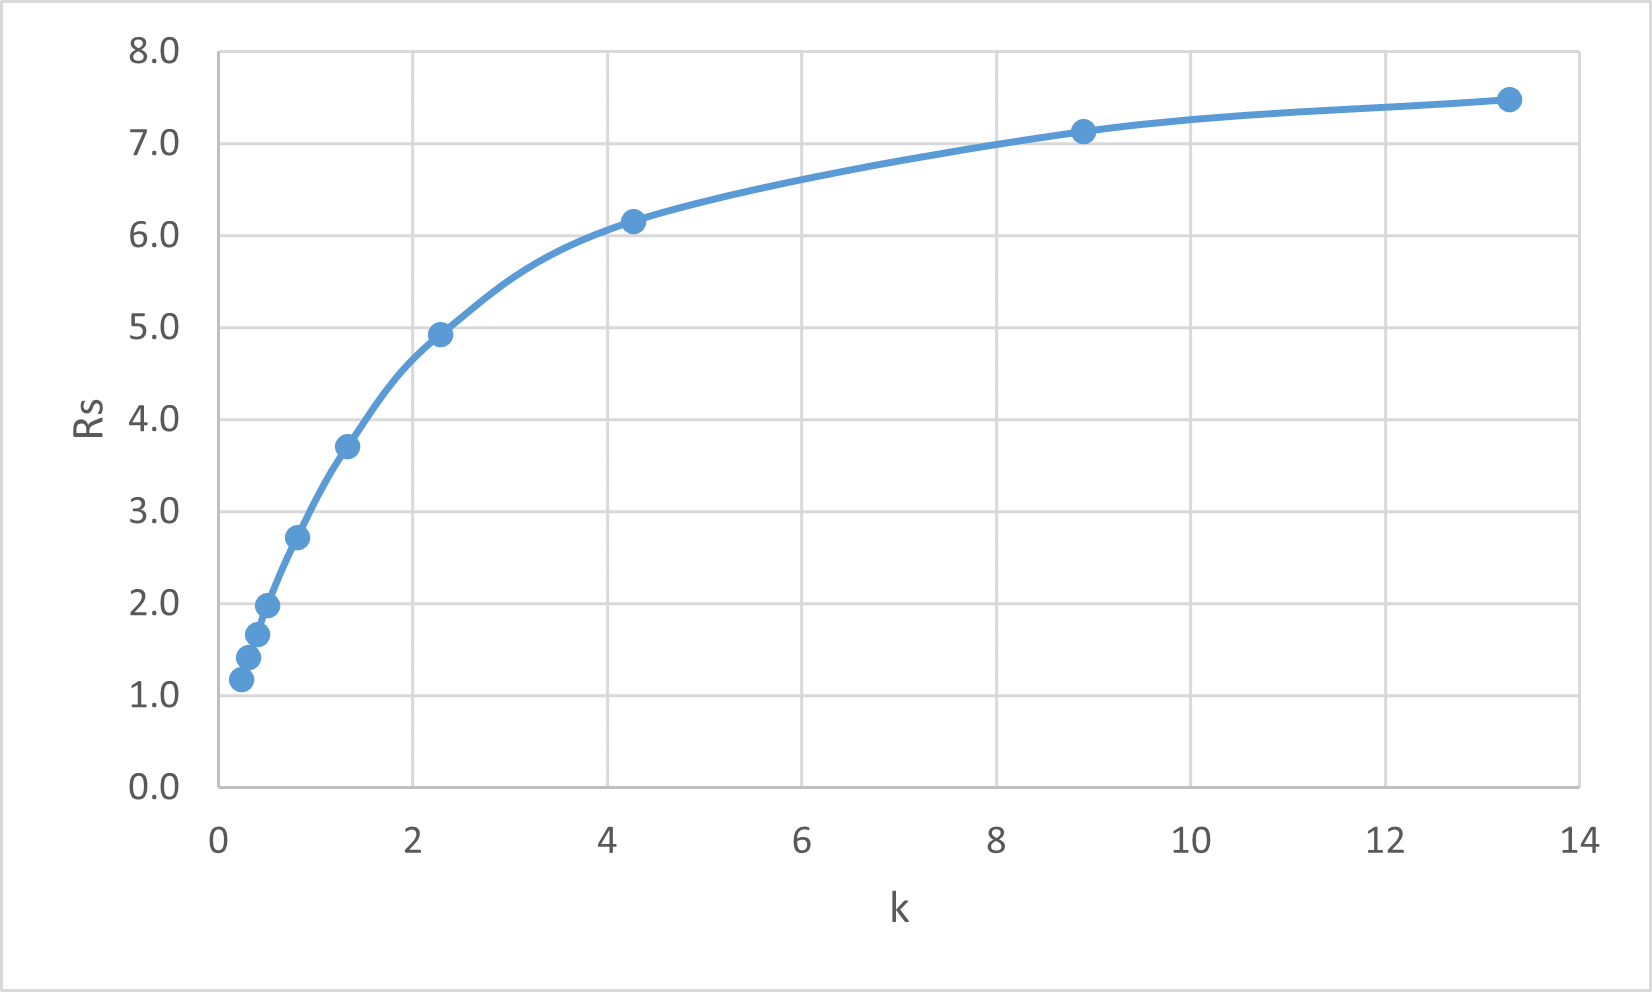
So, changing selectivity is the best option, but changing retention is much easier, and a good place to start. If we just look at the retention term, we can plot its contribution against retention as shown in the following plot.
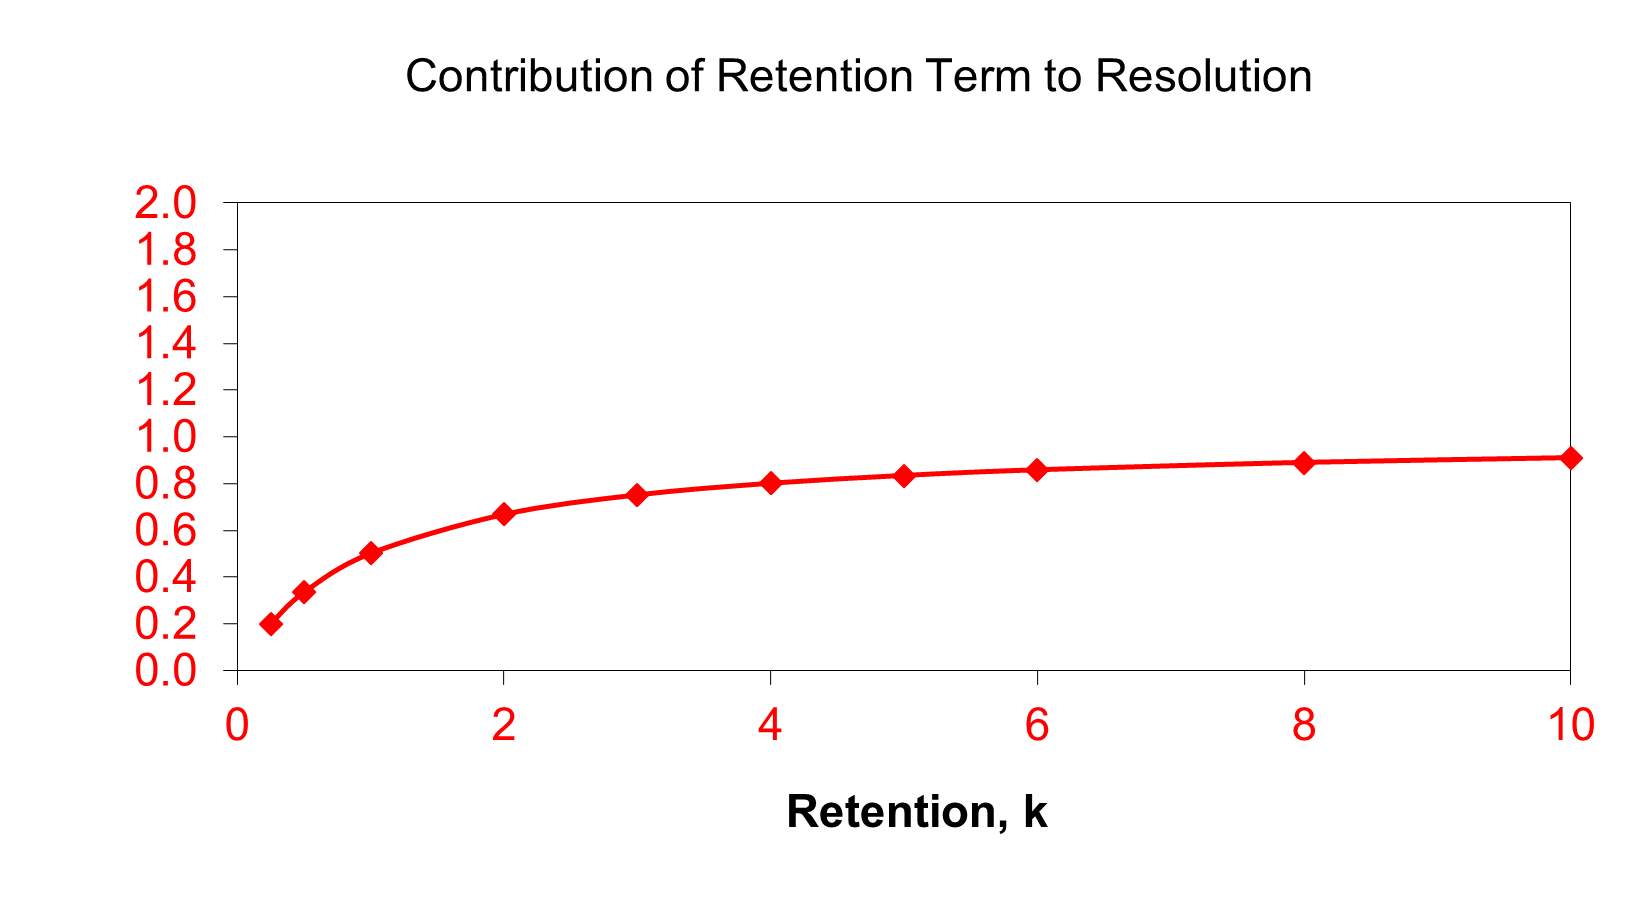
From this graph, you can see that as you increase k, the value of the term gets steadily larger. This means that the resolution will generally increase. At small values of k (eluting close to the void volume), the value of the term is small, and resolution is often poor. Peaks eluting with k values less than 2 are not well resolved and are too close to the peaks eluting at the void time. For retention at values of k larger than 2, the term increases up to a value of about 5. Above that point, the term does not change much, so there is not much advantage to longer retention times. Many references recommend k values in the 2 - 10 range, however, we prefer to recommend a value of not more than 5.
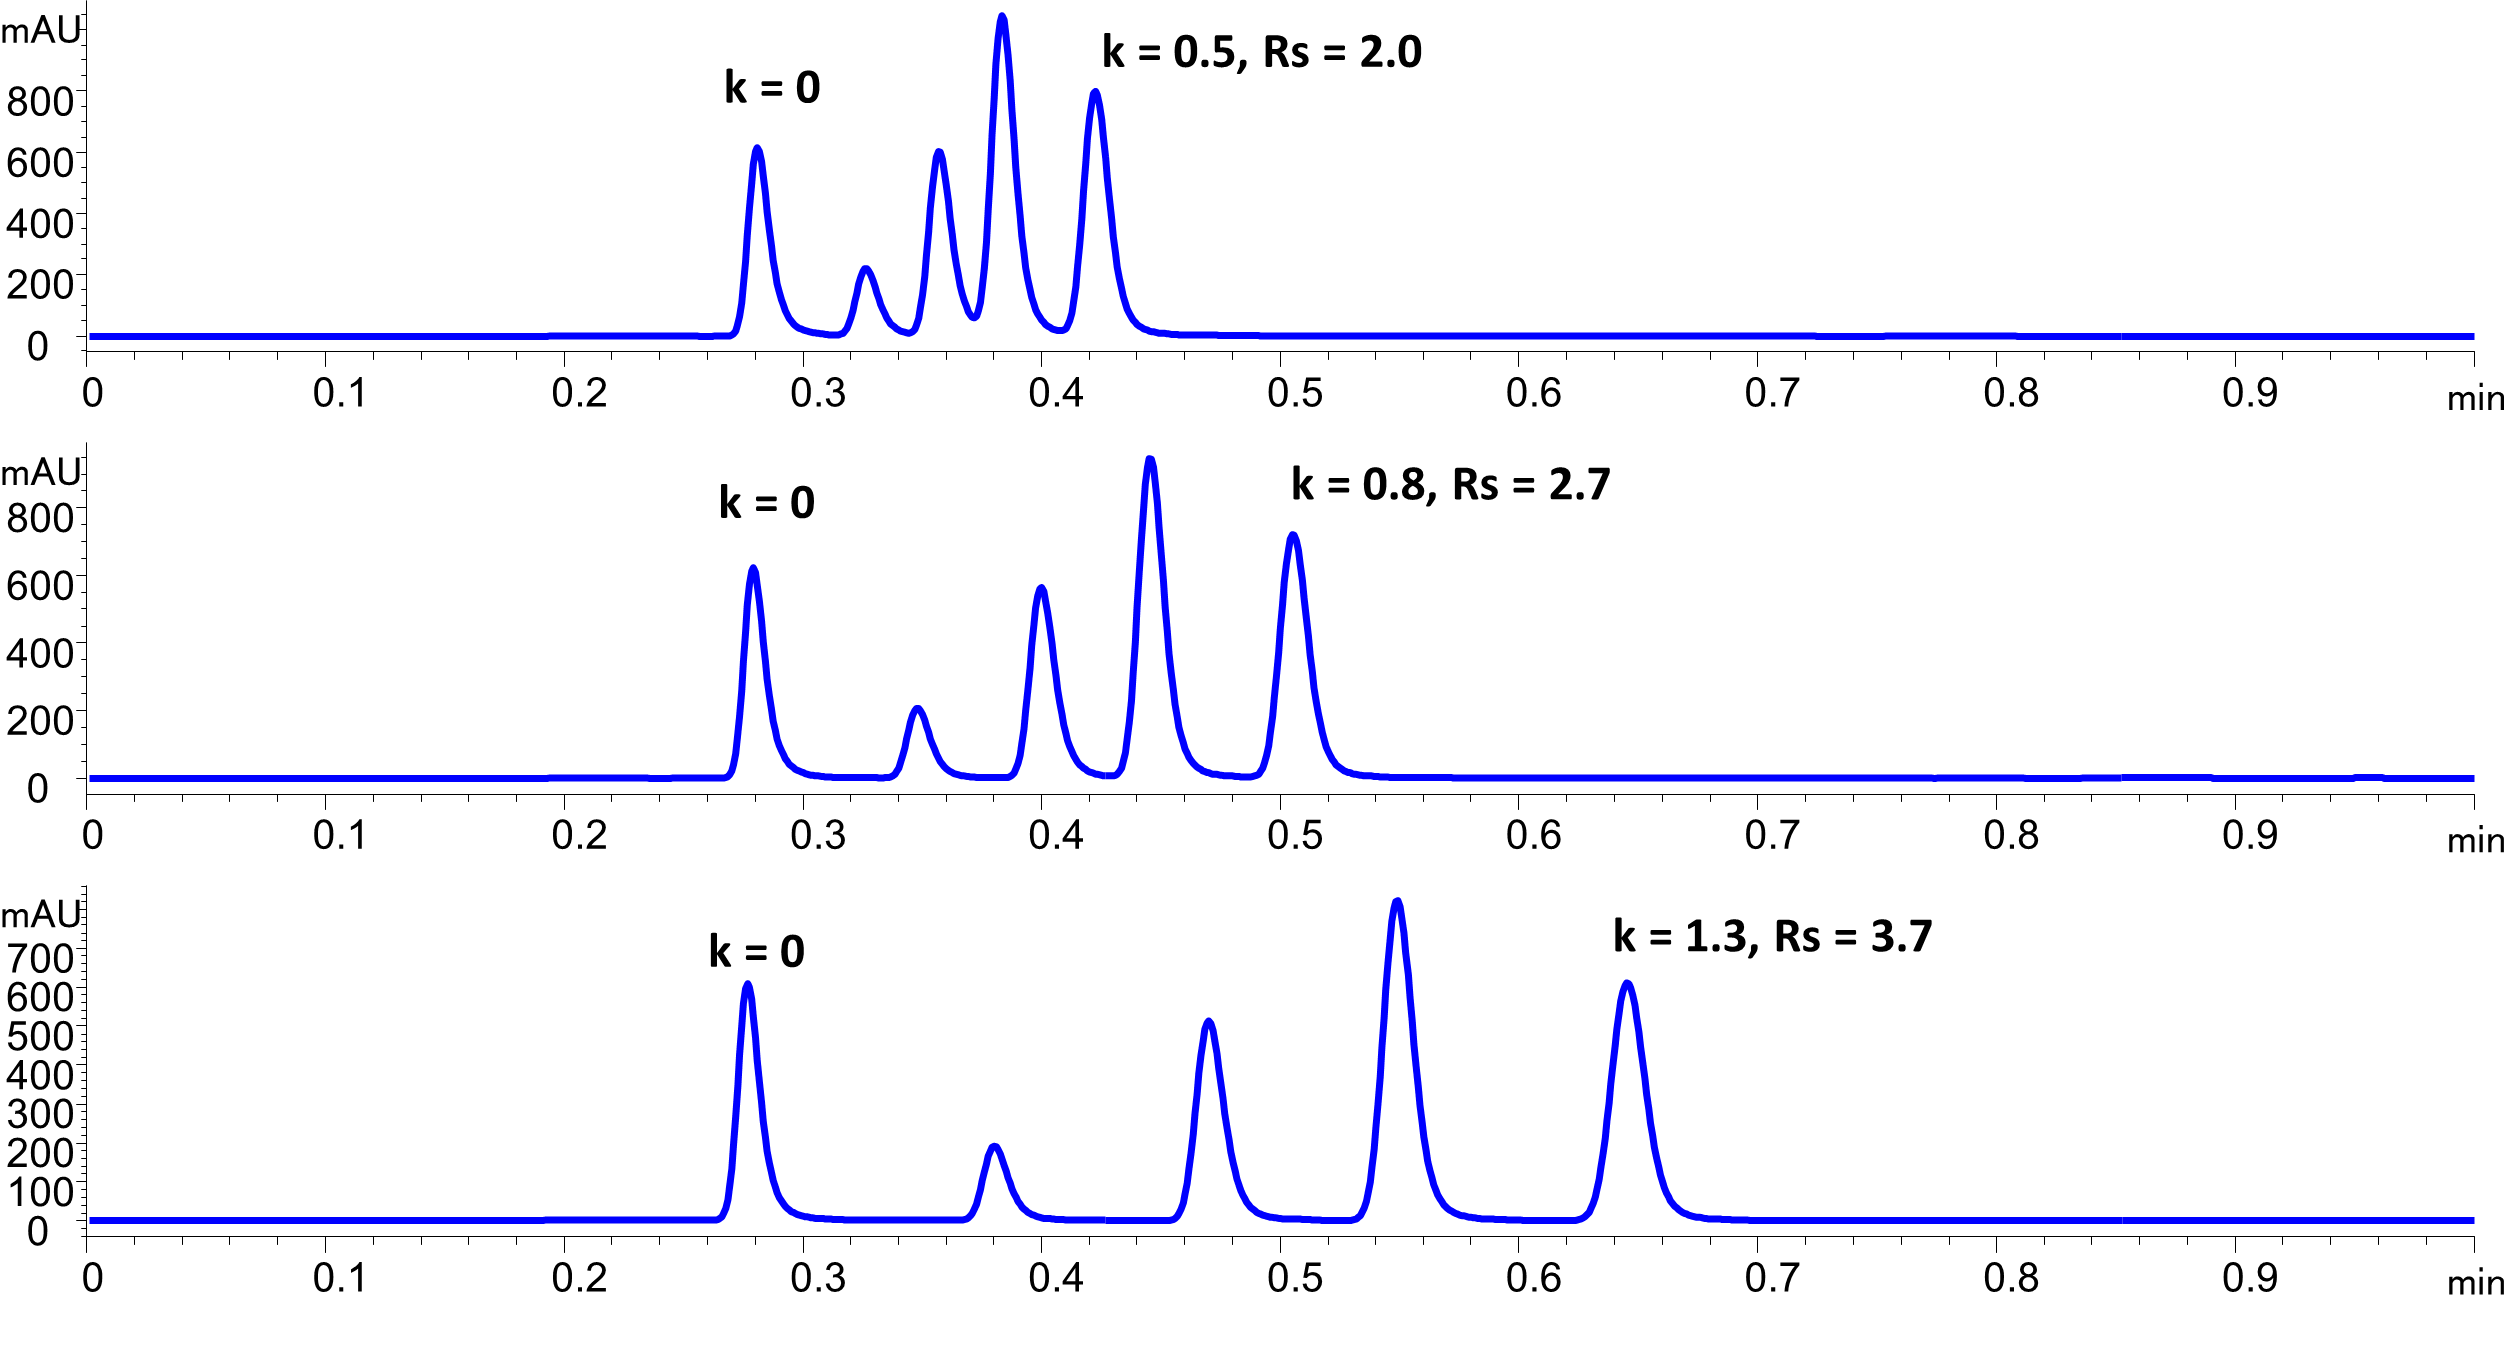
This is all theoretical so far, but actual chromatography confirms these ideas. In the example below you can see the changes as retention is increased (in this case by adjusting the mobile phase).
First, look at the changes in resolution that occur with a change in retention. Resolution at k = 0.5 is barely acceptable at 2.0. However, adjusting the retention so that k = 1.3 almost doubles the resolution to 3.7. However, the retention time only increases by about 50 percent. For small values of k, this approach is a very efficient way to produce a significant increase resolution without a large increase in retention. On the plot of the k term (above), we are moving up the curve toward the region where the curve begins to flatten.
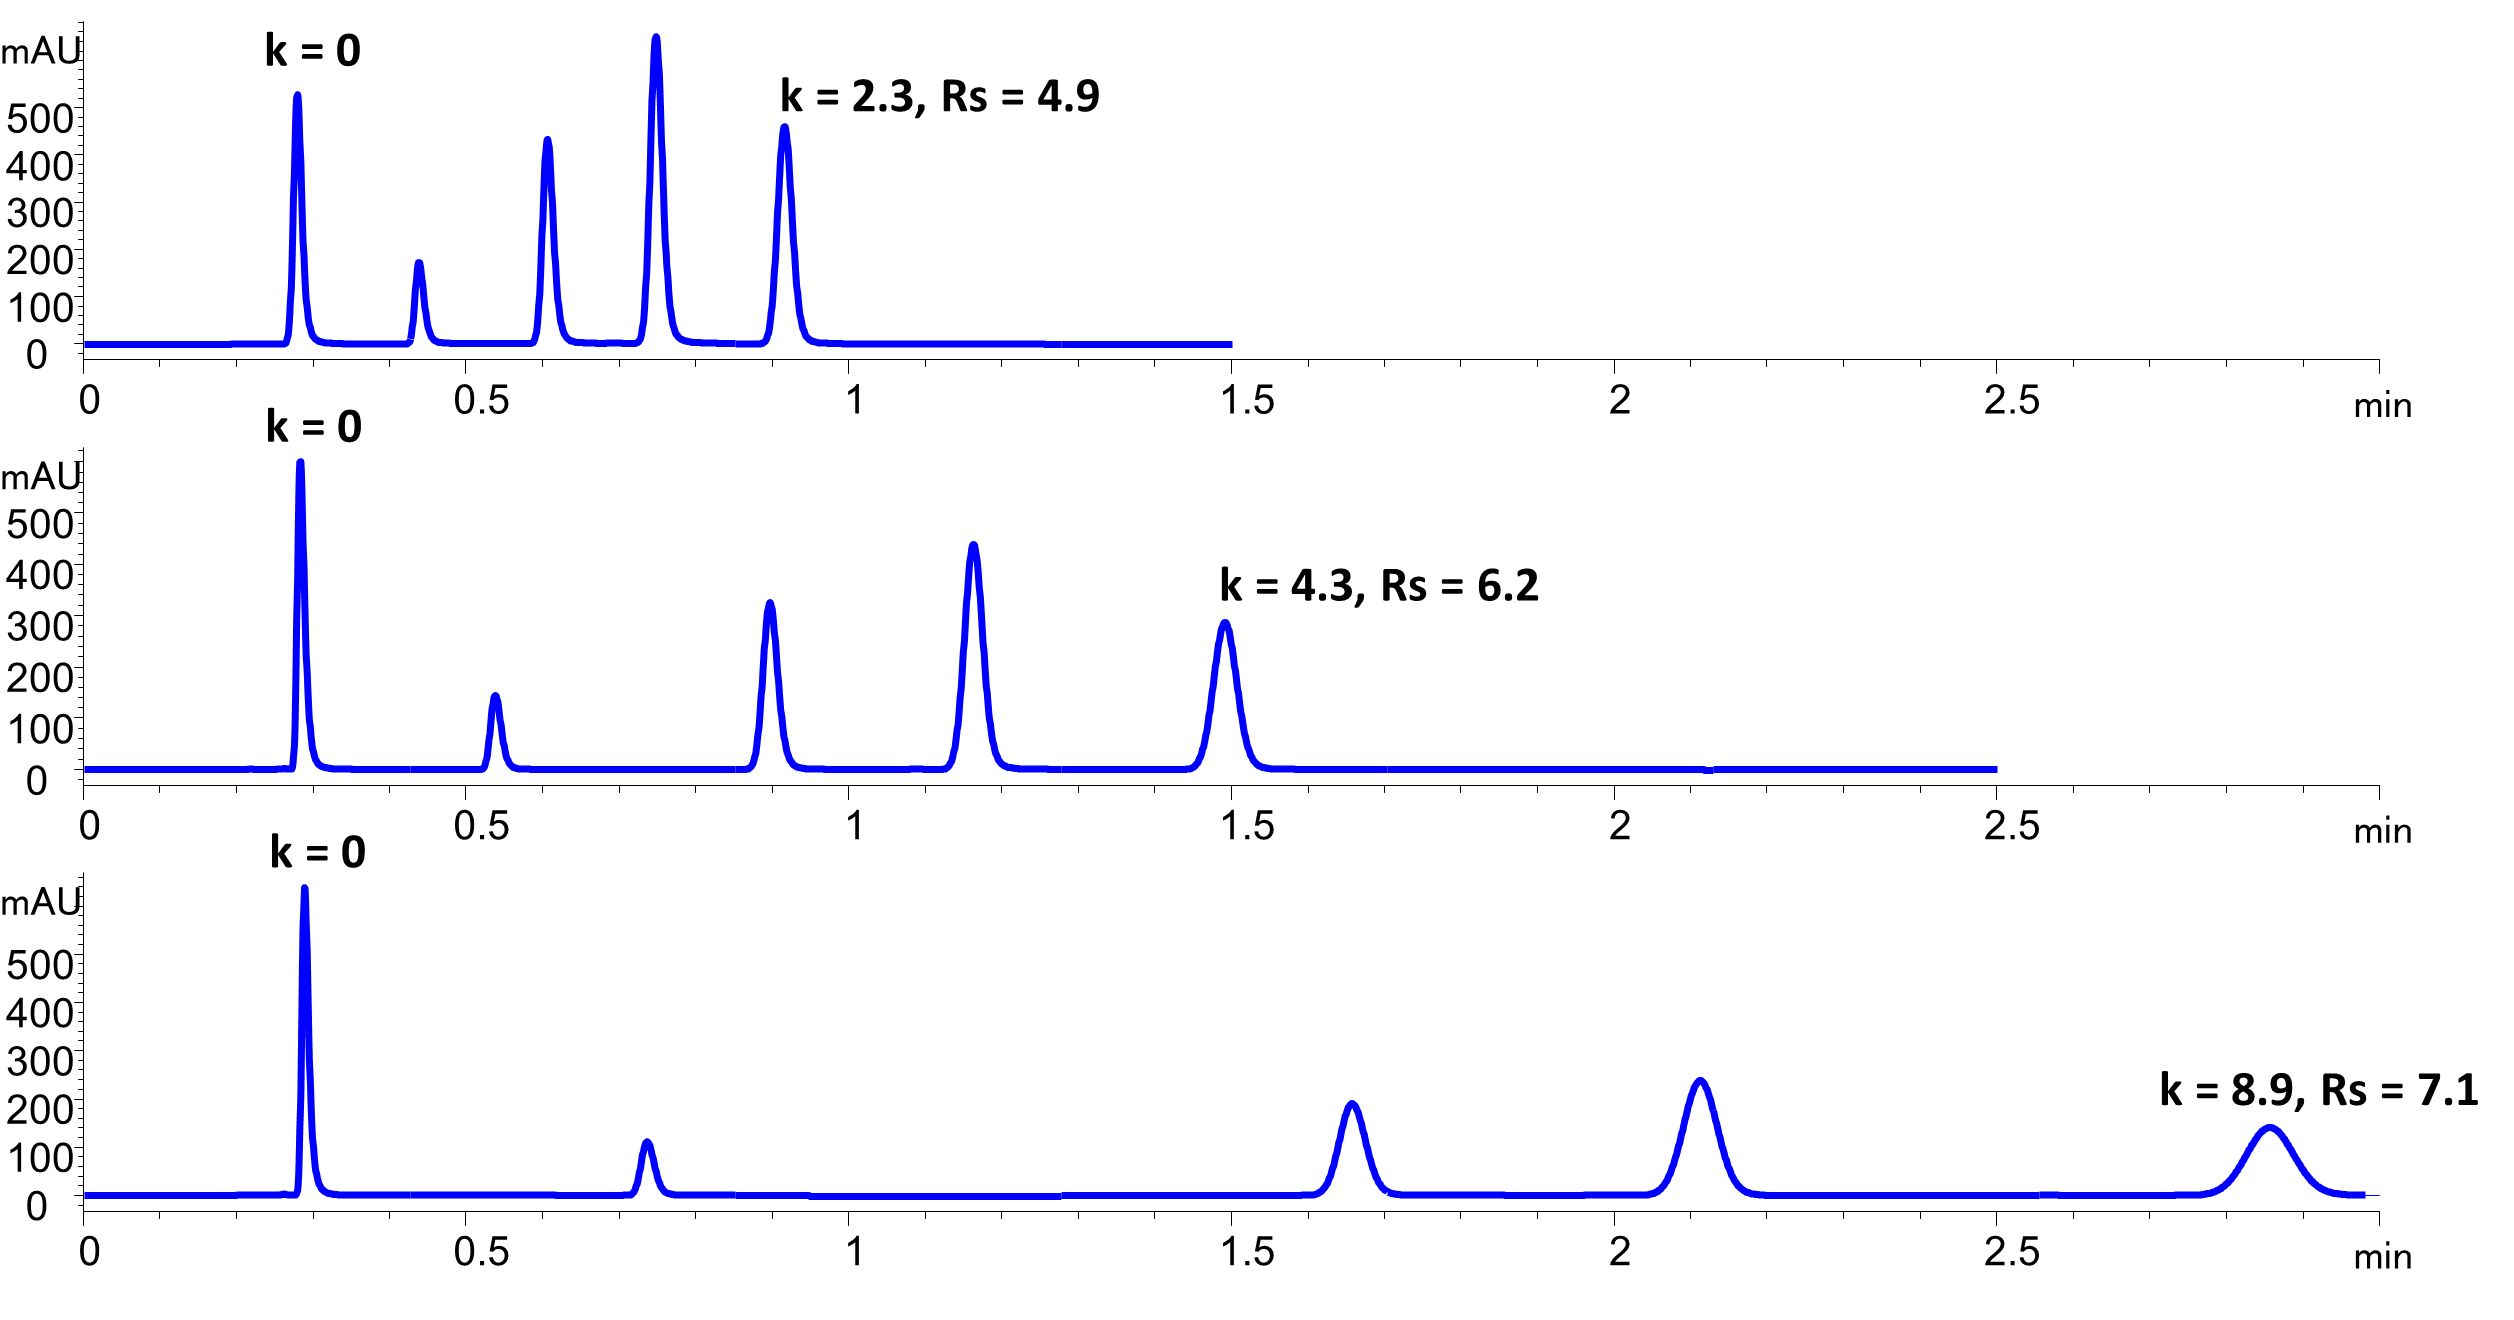
The next example displays the changes for this same mix over a moderate range of k, from two to ten. In this range, the value of the k term does not increase as rapidly as for smaller values, and we see that the results are reflected here.
The resolution increases, as expected, but by a little less than 50 percent. Unfortunately, the retention time increases by more than 300 percent! The examples at k = 2.3 and k = 4.3 are both good options, with short analysis time and good resolution. But adjusting k to a larger value only wastes time, with very little improvement in resolution.
Finally, we want to show you the actual changes in resolution with retention for this entire data set.
This looks like the theoretical plot that we showed above. For many chromatography applications, we would like to see a minimum resolution of four. And we do not want to waste too much time. This plot clearly shows that adjust k values into the range from two to five achieves both results.
|