Part 11: Integration Settings
Several months ago we talked about settings that are to be included in the method. Clearly, you need to give the user advice on how to integrate the chromatograms to generate the most appropriate results.
The question is - What integration advice do I include?
I read many different methods from many different laboratories. Most do not even mention integration. Those that do, usually have what I consider to be the wrong approach. So, this month I am going to switch the format and start with
what you should NOT do:
Do Not:
- Simply list integrator settings with fixed parameters and values.
This is what most methods include, but this is a bad idea. Why? Because it reflects the current obsession with specific rules and procedures. The idea is that more control means more consistent results. However, such an idea only applies if the process is stable and reproducible, and responds the same way in all situations. Real-world chromatography isn't like that.
Baselines, peak shape, noise, retention time, and interfering peaks can all vary between over time. Certainly if there are major changes, that suggests a problem that must be fixed. But many changes are small and within the normal range of variability, yet they may require slightly different integration settings to properly define the peak.
Remember, the settings don't magically create the data that represent peak size. The settings are the instructions to the program for where to draw the integration baseline. It is the position of the baseline that matters.
You need to be able to adjust whatever parameters are necessary to ensure that the integration baseline is created the same way for each sample. Fixed settings will not always satisfy this requirement.
So, what should you do?
Do:
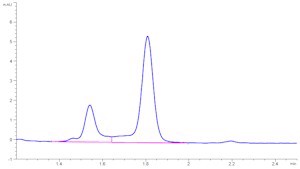
- Include a chromatogram with the "correct" baseline displayed.
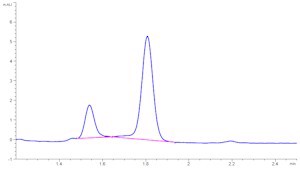
- If certain problems occur with some regularity, you may want to include an example of "incorrect" integration.
- If necessary, include a range of integrator settings that will produce the correct result.
For example, if you have an unusual chromatogram, you might include a figure like this with the caption, "Correct integration settings."
If necessary, add an example of "Incorrect integration settings."
Finally, include a range of settings,such as:
Peak Threshold = 0.1 - 1.5
With the following instructions:
"Adjust the settings as needed over the indicated range to produce an integration baseline similar to the 'good' example. If you cannot produce acceptable integration using these values, contact your supervisor for instructions."
Next Month: User Questions and a summary of the HPLC Method Development Workshop in Nairobi, Kenya.
Would you like comment on this series or make suggestions? Contact us.