 |
Recent State and Local Education News
|
Virginia’s McAuliffe takes emergency steps to curtail teacher shortage
The Washington Post
December 11, 2017
In a bid to curtail Virginia’s teacher shortage, Gov. Terry McAuliffe took emergency action Monday to get aspiring instructors into classrooms faster by streamlining education requirements.
McAuliffe ordered the Virginia Board of Education to implement an emergency regulation that would allow the state’s public colleges and universities to start offering undergraduate students a major in education by March 1.
“The teacher shortage is a growing crisis that we have to stop and reverse if we are serious about the commonwealth’s economic future,” McAuliffe said in an emailed statement. “High quality teachers are the key to unlocking the potential in our children.”
Most public colleges and universities in Virginia require that teaching candidates first complete a bachelor’s degree in a subject area such as math, science or social studies, said Jim Livingston, president of the Virginia Education Association, one of the state’s confederation of educators. Then, aspiring educators must enter a teacher preparation program, which often requires a fifth year of school, Livingston said.
Virginia adopts computer science standards for K-12
Daily Press
December 12, 2017
The Virginia Board of Education voted last month to become the first state to adopt mandatory computer science standards for all students.
The computer science Standards of Learning were unanimously approved after lengthy discussion on Nov. 16. They laid out the four key fundamentals that must be taught: computer literacy, educational technology, digital citizenship and information technology.
Each of these concepts is interwoven into other content areas in most cases. Computer literacy means just that: making sure a student knows how to use computers and programs and can demonstrate that by creating a digital presentation.
Educational technology applies computer literacy to other subjects, such as a science class using an online document to collaboratively write a lab report. Digital citizenship standards should help students learn how to appropriately and safely use technology, and information technology covers the industrial applications of computers, such as installing software.
Virginia Schools Closing Internet Connectivity Gap
NBC 29 (WVIR-TV)
December 11, 2017
The schools attended by approximately 75 percent of Virginia’s 1.3 million public school students now meet or exceed the Federal Communications Commission’s minimum standard for internet connectivity, according to the non-profit organization EducationSuperHighway’s latest state connectivity snapshot. In 2015, only about 14 percent of Virginia students attended schools meeting the FCC standard.
“Access to high-speed internet is critical in preparing our students for success in the new Virginia economy,” Governor Terry McAuliffe said. “Improving connectivity and increasing broadband statewide allows the students of today to become the highly skilled workforce of tomorrow, and I am proud that the commonwealth is leading the way in this vital effort.”
Study estimates one-third of Virginia children not ready for kindergarten
Richmond Times-Dispatch
December 11, 2017
More than one-third of Virginia children are not ready for kindergarten, according to a new legislative study that says the true scope of the problem isn’t known because less than half of the state’s school divisions participate in the assessment of critical skills to determine children’s readiness for kindergarten classes.
The report to the Joint Legislative Audit and Review Commission on Monday suggested that the General Assembly consider requiring all school divisions to participate in the Virginia Kindergarten Readiness Program over the next three years in order to assess the abilities of children across the state to enter school with the social skills, self-regulation, literacy and math ability necessary to succeed in the classroom.
“You don’t know what you don’t know,” said Del. Robert D. Orrock, R-Caroline, the chairman of the bicameral legislative commission.
House Appropriations Chairman S. Chris Jones, R-Suffolk, said he will introduce legislation this year to carry out the report’s findings, including concerns over the lack of data to assess how many children need help and what kind of assistance would benefit them most. “It will be a structured, multiyear approach,” Jones said.
The new study cited a three-year-old assessment, based on a representative sample of children across the state, that found that 34 percent were not fully ready to enter kindergarten, primarily because they lack the social skills and ability to regulate their own behavior.
State superintendent talks graduation, accreditation
Daily Press
December 11, 2017
State Superintendent of Public Instruction Steve Staples stopped by the Daily Press Monday morning.
Staples is visiting newsrooms across the state to talk about changes made in two big areas of education: graduation requirements and the accountability system that accredits schools.
Staples, who is set to retire Jan. 1, 2018, walked through the new criteria for graduation, which reduces the number of credits a student must earn by passing a social studies Standards of Learning test.
|
Recent National Education News
|
Each State Graded on High School Personal Finance Education
Business Wire
December 12, 2017
States are making modest improvements in personal finance education standards, but they still have a long way to go, according to the third report card on state efforts to improve financial literacy in American high schools.
John Pelletier, director of the Center for Financial Literacy at Champlain College, which produced the report card, says American high schools have improved incrementally, in part because previous report cards have energized debates and legislation in many states.
Pelletier notes that research from Next Gen Personal Finance indicates that students from wealthy communities are much more likely to have access to personal finance education in high school than students in poor communities. “The poor should have equal access to personal finance education in high school—it shouldn’t be for just the rich,” he says. “But access is only possible if a state policy requires it.”
The report card gives grades to all 50 states and the District of Columbia. You can see all states and their grades in the 2017 report card.
Pelletier also notes that studies demonstrate that financial literacy educational interventions in high school appear to have a positive impact on knowledge and measurable financial behaviors.
Illinois, Texas, Virginia, Washington state and West Virginia have enhanced financial literacy education of high school students since the 2015 report card. Arkansas, Delaware, Nevada and Vermont are in the process of making changes that could improve their overall grade once the proposed changes take effect.Unfortunately, Louisiana abandoned its mandatory personal finance education requirement, and Idaho reduced the number of class hours required for the subject.
Only Utah earned an A+, while Alabama, Missouri, Tennessee and Virginia earned A grades. These states require students to take a standalone course.
|
|
|
How do school systems measure up when student growth is the measuring stick?
Before we dive into the question for this month's Compass Point, we wanted to start with greetings from all of us here at the Wilder School at VCU! We hope your 2017 finishes well and that 2018 holds new and exciting opportunities.
Now to our topic of growth as a measurement. Back in
August we discussed changes being produced by implementation of the Every Student Succeeds Act (ESSA). As we noted, under recently passed regulations, accreditation in Virginia will now include metrics other than standardized test performance, including "outcomes such as student growth, achievement gaps, dropout rates, and chronic absenteeism." But what difference might looking at growth rather than performance make?
A
new study out of Stanford's
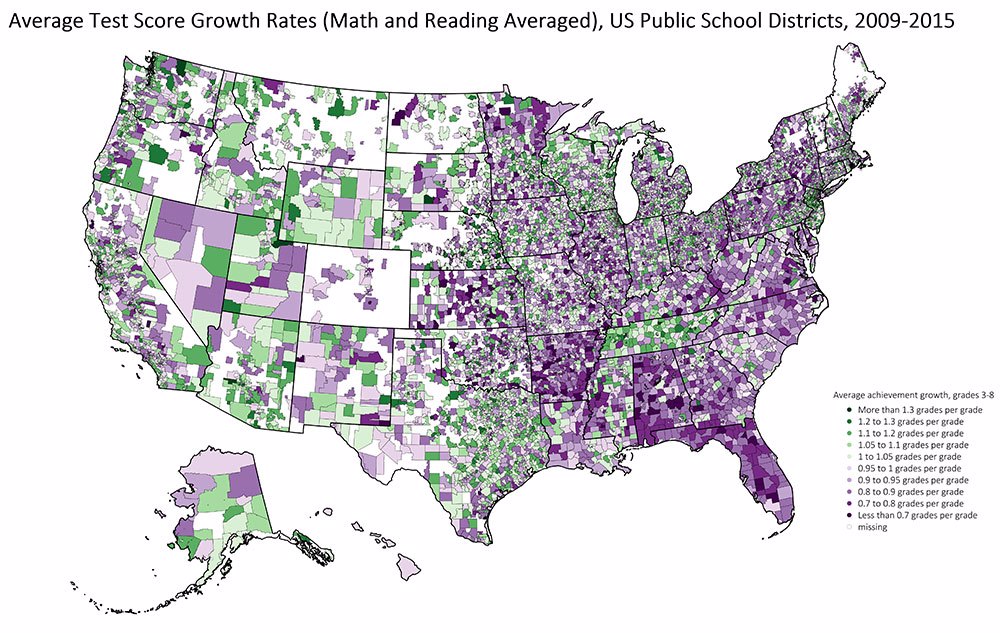
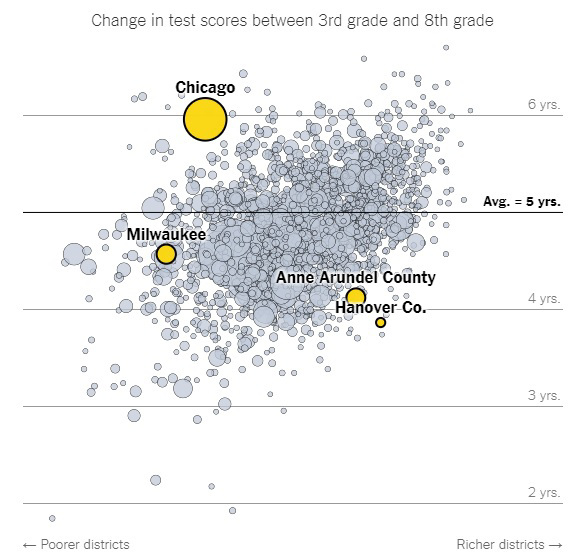
Center for Education Policy Analysis hones in on one student growth metric and according to their report, looking at growth makes a lot of difference. Using data from more than 11,000 school systems, the report maps which systems have the greatest average learning among their students from grade 3 to grade 8. As the authors note, while 3rd grade scores "can be thought of as measures of the average extent of educational opportunities available to students in a community prior to age 9," the change from grade 3 to 8 "can be thought of as reflecting educational opportunities available to children in a school district between the ages of 9 and 14."
As the
Upshot blog from the New York Times observed, the results "defy how we typically think about wealth and education in America." Some school systems, such as Chicago Public Schools, end up performing much better than their long-time reputation as a struggling urban system (a reputation partly based on having a large portion of their students from disadvantaged socioeconomic communities who enter school with lower skill sets.) Anne Arundel County in Maryland, often seen as a high-performing system when measured by grade-level test scores, appears less effective when the growth measure is used. (The Upshot blog has a customizable graphic interface that allows you to enter your own school system and see where they fall - at random we entered Hanover County as a Virginia system.)
 |
|
The
national picture produced by Sean Reardon and colleagues at Stanford looks like the map below - those school systems in green produce more than one year of growth per year spent in school among their students. Those in purple produce less than one year of learning growth per year spent in school. Tennessee has a high concentration of green - certainly more so than Virginia or North Carolina.
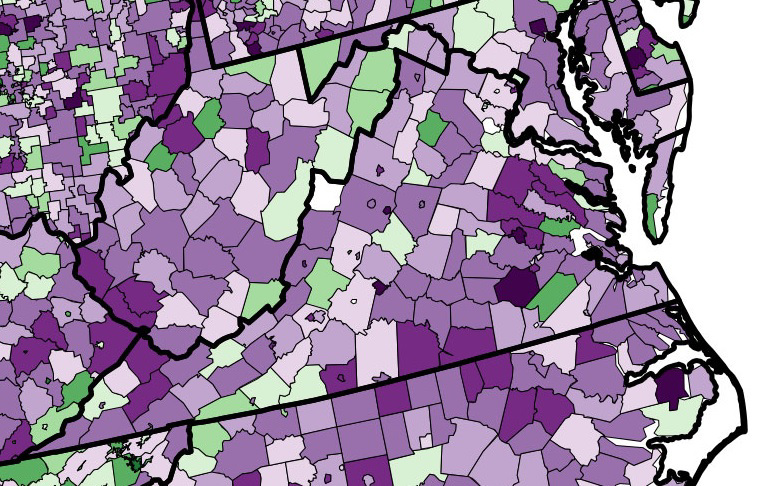
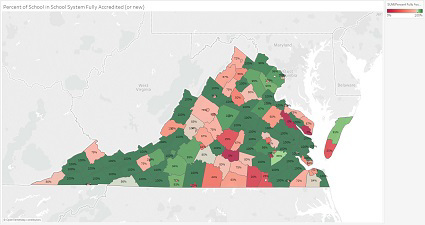
The picture in Virginia (simply a zoomed in version of the first map) looks like the top map below. And you can see, by comparison to the accreditation results map we published in November that the some school systems that look strong when average test scores are the measure look less strong when growth is the focus.
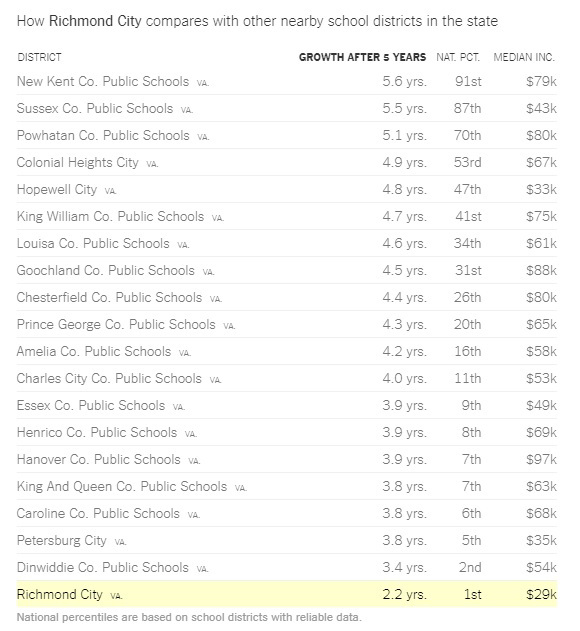
The
Upshot blog also provides an interactive graphic that allows a user to compare the growth data of one school system to that of neighboring systems. Below is the result when Richmond City Schools are entered (chosen since VCU is located in the city of Richmond). Richmond, often in the headlines for low test scores in an annual snapshot, fares no better when growth is the measure. However another frequently troubled system, Petersburg, while still far down on the list, is actually only .1 lower in terms of average growth than Henrico or Hanover schools, which are often considered strong systems.
This different picture from looking at growth measures may be one reason that public support appears strong for incorporating growth into assessments of school systems. In July we fielded several related questions as part of the Summer Public Policy Poll, conducted by the Office for Public Policy Outreach here at the Wilder School's Center for Public Policy. One question asked whether the public thought student improvement or performance on standardized tests was a better measure of school success. See the
Poll Update below for the results or check out the full range of poll questions
here.
And speaking of our poll, the Winter Public Policy Poll from the Wilder School is due out in the second week of January and will cover topics such as the perceived sufficiency of education funding as well as questions related to workforce development, public safety and health. Keep an eye out for those results and the return of our updates on the General Assembly. Until then, best wishes for the new year!
Sincerely,
CEPI
|
Poll Spotlight - Public Opinion on Accountability
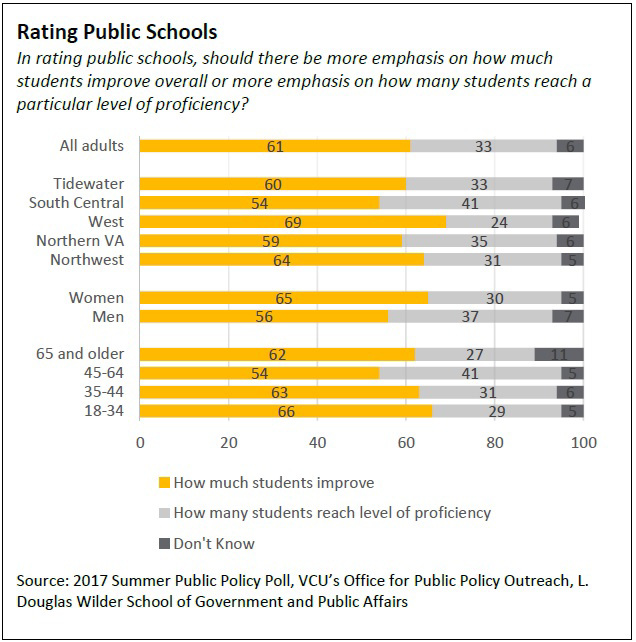
Within the significant and ongoing debate about the use and number of standardized tests to rate public schools, the definition of how to measure student achievement has become especially relevant.
A majority of Virginians, 61 percent, thought that when rating public schools, there should be more emphasis on how much students improve overall, compared to 33 percent who thought more emphasis should be placed on how many students reach a particular level of proficiency.
Regional differences exist with respondents from the West region (at 69 percent) being more likely to say emphasis should be placed on overall improvement and respondents in the South Central region (at 41 percent) being more likely to say emphasis should be placed on reaching a particular level of proficiency. Women (65 percent) were more likely to think emphasis should be placed on overall improvement than men (56 percent). Meanwhile, respondents ages 45 to 64 were more likely to think emphasis should be placed on reaching a particular level of proficiency with 41 percent, compared to 31 percent of those ages 35-44, 29 percent of those who ages 18-34, and 27 percent of those 65 and older.
|
|