|
Compass Point
A collection of data, articles and insights from the
Commonwealth Educational Policy Institute
|
A program of Virginia Commonwealth University's Office of Public Policy Outreach
Part of the Center for Public Policy at the
L. Douglas Wilder School of Government and Public Affairs |
|
|
|
|
|
Graduation season rolls across the commonwealth |
|
|
High school graduation season is a wonderful time of celebrating the collective work for a family and the larger community in a student completing thirteen years of schooling.
Through late May and early June, thousands of students in Virginia's high schools are hearing their names called and crossing a stage into the next part of life. In light of this, we thought we would take a look at both where most graduates are coming from (based on last year's numbers) and at whether the public thinks high school graduates are ready for the next phase of life (check out our
Poll Spotlight.)
If you're interested in some numbers, the 2017-18 graduating class will hope to continue the growth trend in the number of Commonwealth residents completing a high school diploma. In 2015-16 88,848 students received a high school diploma, up from 78,485 a decade ago. In 2016-17, the number of graduates grew to 89,699.
Of the 2016-17 graduates, 49,794 or 56% of the total graduates or completers received advanced diplomas (which require an additional credit in math, science, social studies and a foreign language). This was up from 46% percent in 2015-16.
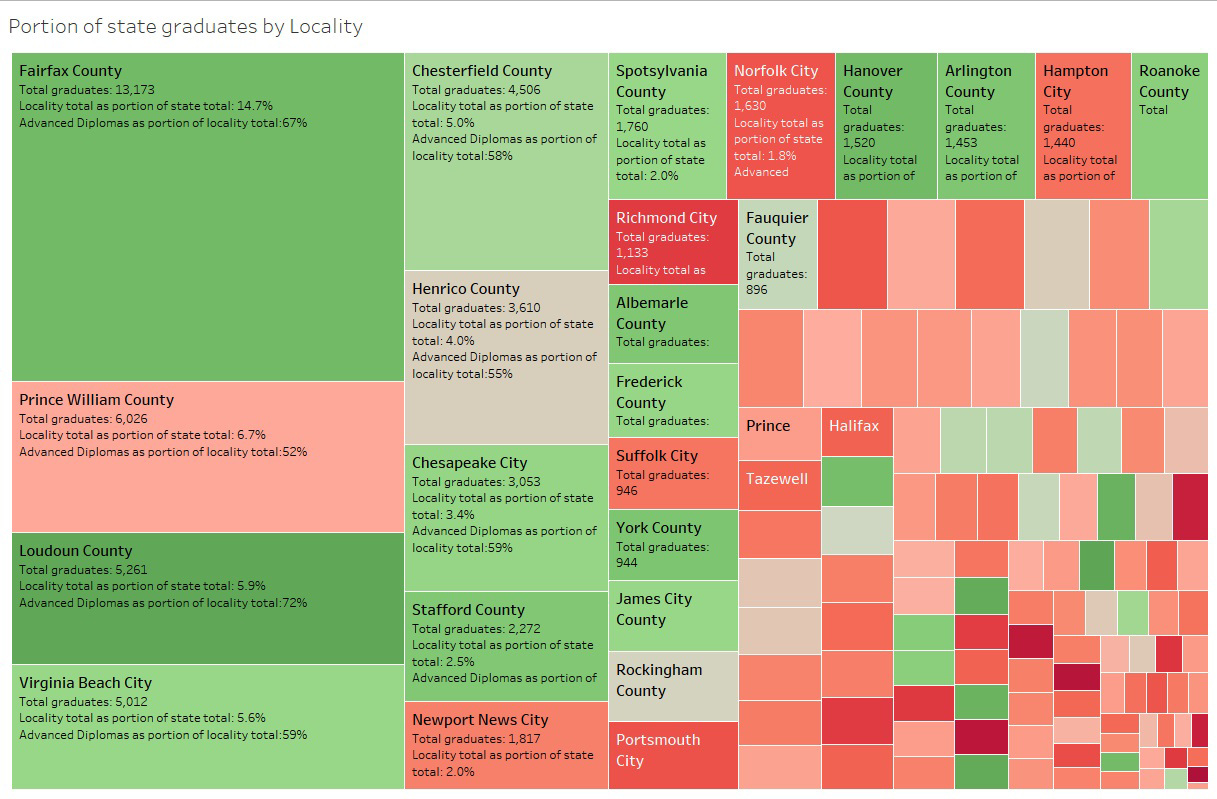
It's also interesting to look at where the most new graduates are geographically. The area box chart below provides a clear sense of how many of the commonwealth's graduates are concentrated in a relatively small number of localities. The five largest localities (Fairfax, Prince William, Loudoun, Virginia Beach and Chesterfield) accounted for almost 38% of graduates in 2016-17.
|
|
|
Source: Virginia DOE - interactive visualization available
at this link.
The box chart is also shaded based on another dimension of the data on graduates - the percentage of the total diplomas awarded by a locality that were advanced diplomas. Those in green are above the state average (about 56%) while those in red are below the state average. The deeper the shade, the further above or below the average the locality is. While exceptions are apparent, most of the largest school systems are above the state average when it comes to advanced diplomas.
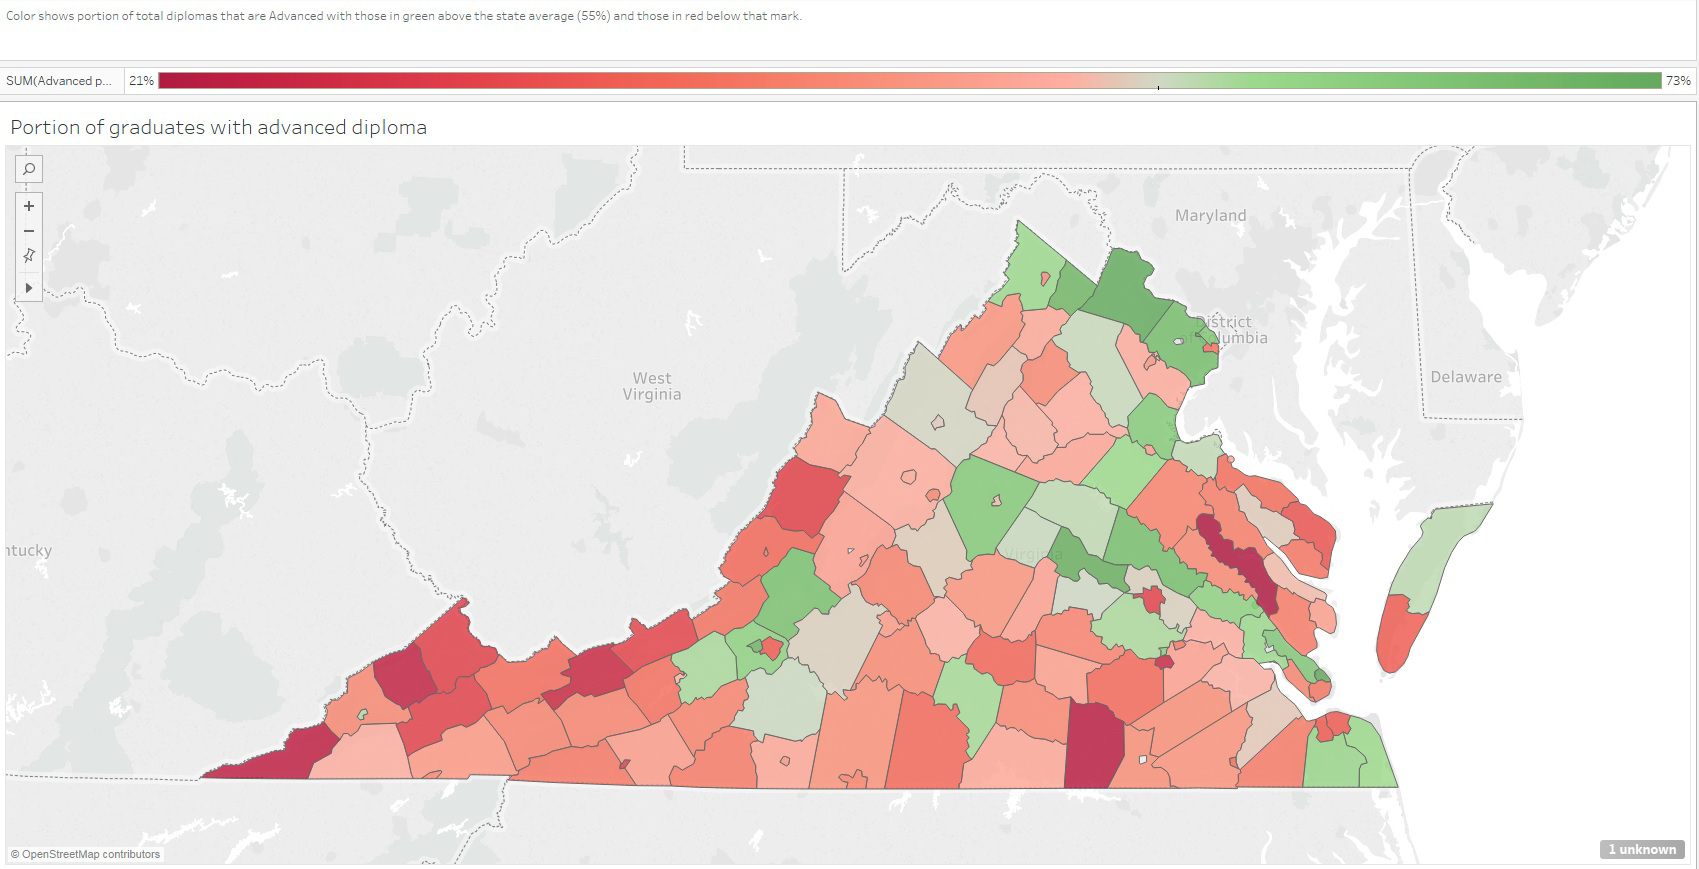
The visualization below allows us to see patterns in the geographic location of those localities that are above the state average for advanced diplomas. With some exceptions, the green areas are suburban surroundings of major metro areas, as well as those served by major interstate corridors (particularly I-66 and I-64).
|
|
|
Source: Virginia DOE - interactive visualization available
at this link.
The growth in the number of diplomas awarded, including advanced diplomas, bodes well for the success of graduates as they take the next step. That said, some may still have butterflies in their stomach as they strike out into the world. For more on whether the public feels that graduates are ready for the next phase, read on below. We hope you have a great rest of June.
Sincerely,
CEPI
|
|
|
Poll spotlight: Are high school grads ready for the next phase? |
|
|
The graduates walking across stages this week, or those represented in last years numbers above, go on to college or enter the workforce directly, which raises the question that may cross many a parent's mind at that moment when they take the next step - "Are they ready?"
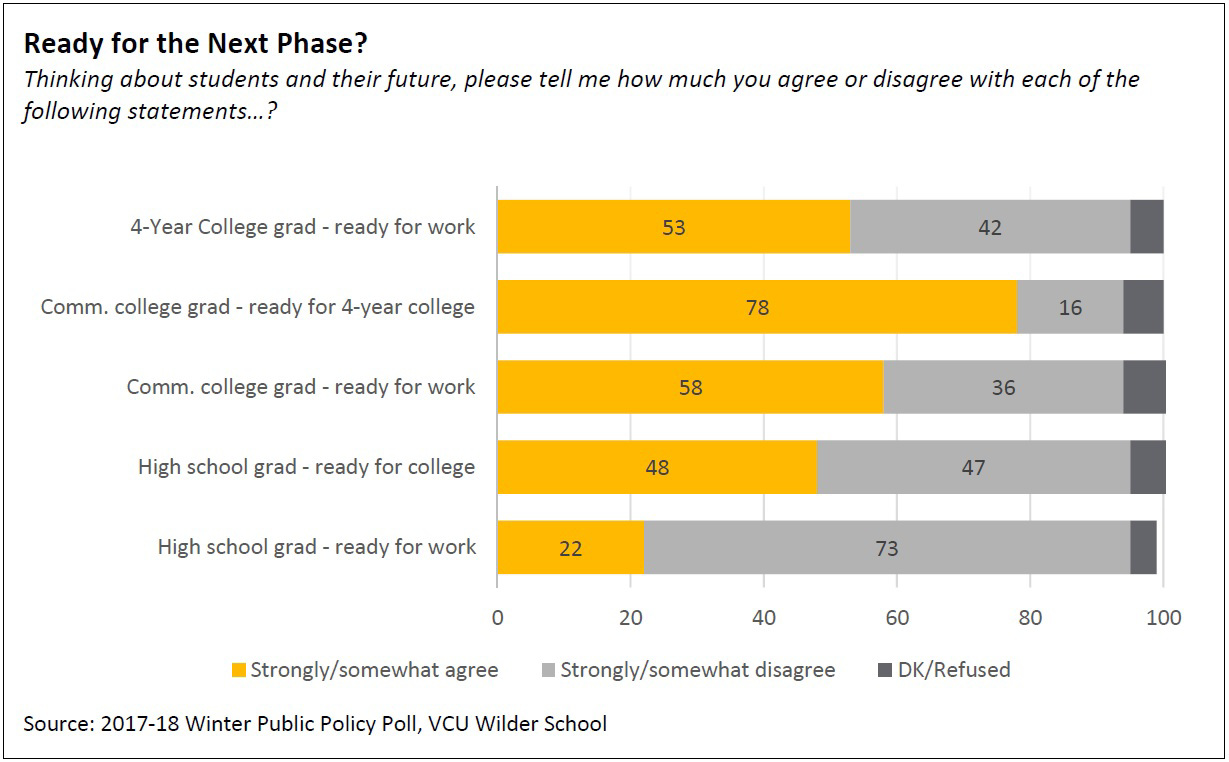
The real answer to that depends, of course, on each individual student. But to understand what the public thinks, the Winter 2017-18 Wilder School Public Policy Poll of Virginians asked respondents whether they thought high school graduates were "ready for the world of work" and "ready for college." The results above show a large majority (73 percent) who don't think high school grads are workforce ready. Public opinion is almost evenly split on college readiness (48 percent agree, 47 percent do not).
|
|
|
More detailed insights include:
- Regionally, Northern Virginia respondents (at 80 percent) were most likely to disagree about workforce readiness.
- On the question of college readiness, a significant difference of perspective exists between household income groupings — those with incomes below $50,000 were more likely to disagree (55 percent) than was the case for those in higher income groups (48 percent for $50K to $100,000; 37 percent for $100,000+).
These and other insights are in our Winter 2017-18 Wilder School Public Policy Poll. Click on the button below to access the full results.
|
|
|
| |
|
 |
|
|
|
|
|
|
 |
|
|
|
|