|
Compass Point
A collection of data, articles and insights from the
Commonwealth Educational Policy Institute
|
A program of Virginia Commonwealth University's Office of Public Policy Outreach
L. Douglas Wilder School of Government and Public Affairs |
|
|
|
|
|
Editor's Note - With the commonwealth focused on the debate between the House, Senate and Governor over Medicaid expansion, there are good comparisons out there of each version of the budget and the respective impact on education,
including this one from the Commonwealth Institute for Fiscal Analysis (see page 3 for K-12 comparisons).
This Compass Point looks instead at the direct connections between Medicaid and education services that already exist, with or without what has become known in Virginia as Medicaid expansion. In addition to our
lead article by CEPI Spring intern and VCU School of Education Ph.D. student Cassandra Boyd Willis, we also share about two upcoming education events in Richmond being organized by the VCU Wilder School's Center for Public Policy and finally, in
our poll spotlight, look at a comparison of the public's willingness to pay more taxes to support schools with high numbers of special education, low-income and English Language Learner (ELL) students. |
|
|
The education-Medicaid nexus |
|
|
Written by Cassandra Boyd Willis
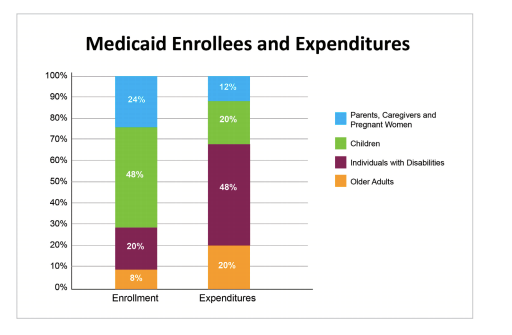
According to the Department of Medical Assistance Services, Medicaid provides effective and high quality healthcare services to 1 in 8 Virginians. While the majority of enrollees are children, individuals with disabilities represent the largest expenditures for service. In FY 2016, over 640,000 children in low income families in Virginia received Medicaid (equaling 48% of enrollees) but only represented 20% of the expenditures. Persons with disabilities and older adults however make up 28% of the population served by Medicaid, but represent 68% of the total expenditures. Medicaid also covers services that commercial insurance policies often deny, including long term care, addiction treatment and early screening. To see all expenditures categorized click
here.
|
|
|
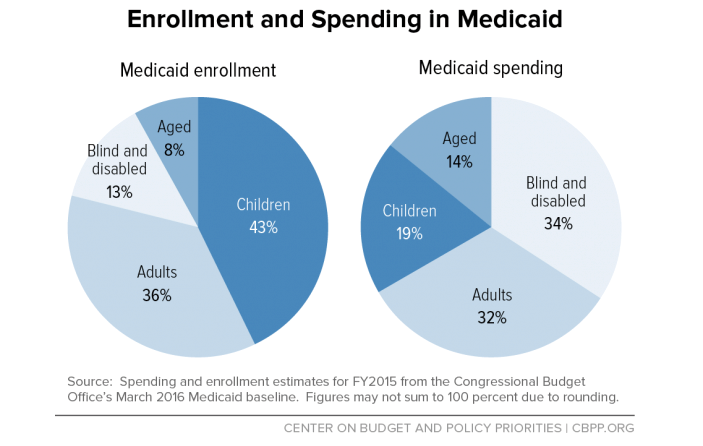
Spending on a federal level is similar to spending at the state level - children represent 43% of enrollees but only 19% of expenditures. According to the
National Alliance for Medicaid in Education, these dollars cover many of the services mandated by Individualized Education Plans (IEPs) including, but not limited to, speech-language pathology, physical therapy, and behavioral and mental health. In 2016 the
Center on Budget and Policy Priorities reported that Medicaid provides several long-term benefits to children who are enrolled and receive regular medical services such as:
- regular attendance at schools,
- improved achievement in school, and
- higher salaries as an adult which impacts their self-sufficiency.
|
|
|
A 2017 School Superintendents Association survey of program coordinators found that 69% of respondents said that the majority of their Medicaid reimbursements go to direct salaries for persons that provide services to students including most of a district's behavior and mental health services. Less well-known is how those service providers also serve students who may not receive Medicaid.
Several policies outline school districts ability to bill Medicaid. The Social Security Act (section 1903(c)) empowers states to bill Medicaid for medically necessary services. Since 1999 IDEA has provided further guidance in 34 CFR §300.154(a)(1), allowing districts to bill Medicaid for the first time. Finally, in 2014, the Free Care Provision allowed school districts to bill for allowable medical services for
any Medicaid eligible student. These services may be inclusive of screenings and assessments, interpreter services, and some types of medical equipment. Allowable services may vary by state; however, districts are reimbursed millions of dollars to assist in providing services outlined by a student’s IEP.
If you want to know more about Medicaid and its impact on education, check out the website of the Department of Medical Assistance
here.
|
|
|
Poll Spotlight - Willingness to pay more taxes for at-risk students |
|
|
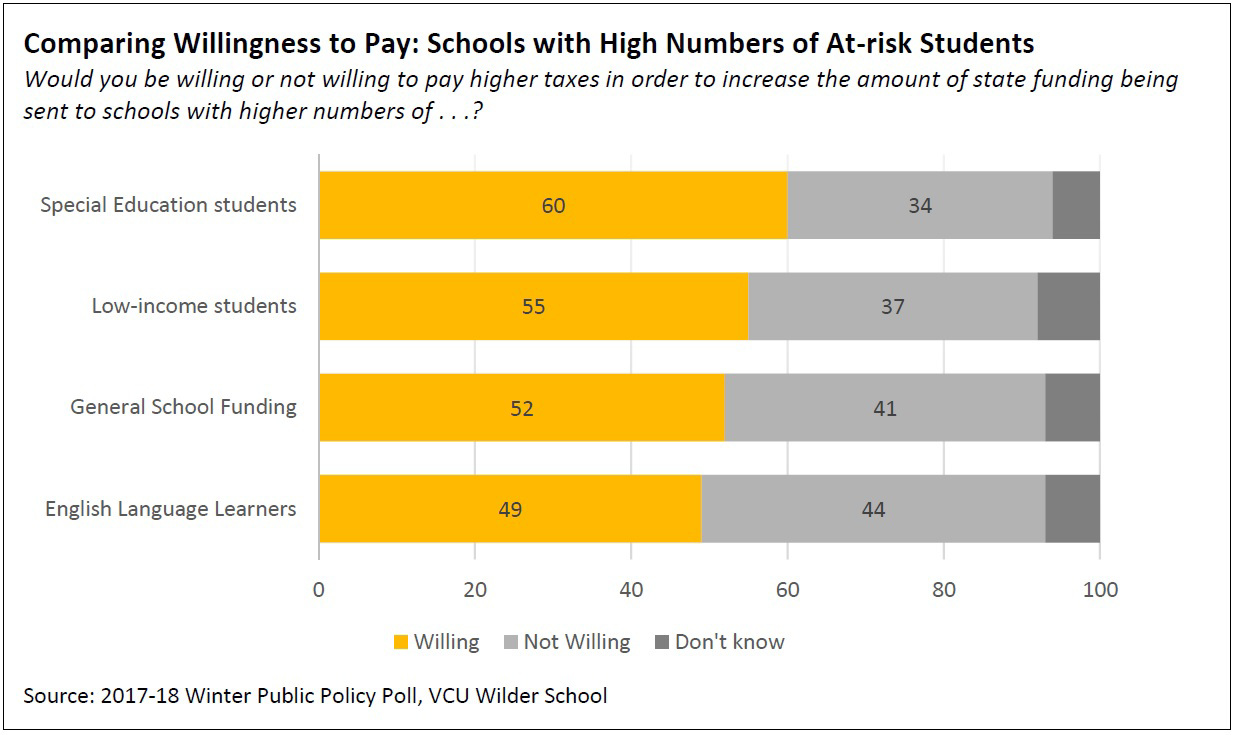
Some policymakers have suggested focusing more funds on schools with high numbers of students who face greater challenges in learning, such as English Language Learners, low-income students and special education students. Compared to the 52 percent willing to pay more to increase school funding overall, more Virginians would be willing to pay more in taxes to increase funding for schools with large numbers of low-income students (55 percent willing) and special education students (60 percent willing.) In contrast, fewer Virginians (at 49 percent) are willing to pay more in taxes if funds would go toward schools with high numbers of English Language Learners, when compared to those willing to pay more taxes to increase school funding generally.
|
|
|
When asked about schools with high numbers of English Language Learners, age, education, race and party identification all showed significant differences. Those ages 18 to 34, at 72 percent, were the most likely to be willing to pay more in taxes to increase funds for such schools, compared to 44 percent for 35- to 44-year-olds, 43 percent for 45- to 64-year-olds, and 37 percent for those ages 65 and older. College graduates, at 58 percent, were more likely to be willing to pay more versus 45 percent of those with some college experience and 41 percent of those with a high school diploma or less. Minority respondents, at 60 percent, were more likely to be willing to pay more in taxes for schools with high numbers of English Language Learners than were white respondents (45 percent). One of the largest demographic gaps was between different party identifications — 63 percent of Democrats would be willing to pay more to support English Language Learners compared to 47 percent of independents and 31 percent of Republicans.
In the case of funding for schools with large numbers of low-income students, those demographic categories with significant differences in willingness to pay were region, gender, age, education and political party identification. Respondents from Northern Virginia, at 62 percent, were more likely to be willing to pay higher taxes than those in other regions, with Northwest respondents being the least likely (at 42 percent) to express a willingness to pay more in taxes for this purpose. Women (62 percent compared to 49 percent for men) and 18- to 34-year-olds (75 percent compared to roughly 50 percent for the other three age categories) were groups most likely to be willing to pay more in taxes. College graduates were more likely to be willing (67 percent) than were those with some college experience (54 percent) or only a high school diploma or less (47 percent). Finally, Democrats were more likely to be willing (72 percent) than were independents (51 percent) or Republicans (39 percent).
As mentioned before, schools with high numbers of special education students received the greatest willingness for support. Again, respondents from Northern Virginia were most likely to support higher taxes to fund special education students (66 percent compared to Northwest at 47 percent). The youngest age cohort (77 percent willing) and college graduates (66 percent willing) were also the most likely to be willing to have their tax bill increased in order to increase funding for special education students. Democrats, again, were more likely to be willing (at 73 percent) to pay more in taxes compared to 54 percent of independents and 45 percent of Republicans.
|
|
|
| |
|
 |
|
|
|
|
|
|
 |
|
|
|
|