 |
Local/State Education News
|
Virginia students to receive $2.29 million in loan forgiveness through settlement with Education Management Corporation
Augusta Free Press
November 17, 2015
For-profit education company Education Management Corporation (EDMC) will significantly reform its recruiting and enrollment practices and forgive more than $2.29 million in loans for approximately 2,000 former students in Virginia through an agreement with Attorney General Mark R. Herring and a group of state attorneys general. Nationwide, the agreement requires the for-profit college company to forgive $102.8 million in outstanding loan debt held by more than 80,000 former students.
“Virginia students are entitled to rely on accurate, complete information when deciding whether a school is right for them. That includes a realistic explanation of the costs and likely benefits from the program they’re considering,” said Attorney General Herring. “EDMC’s practices were unfair to Virginia students and to taxpayers who backed many of the federal student loans that were destined to fail. This is a strong agreement that gives thousands of Virginia students millions in financial relief, and it helps ensure that the company will make substantial reforms to its business practices for future students.”
More than 11,000 school staff members are ‘missing’ from Virginia schools
The Washington Post
November 14, 2015
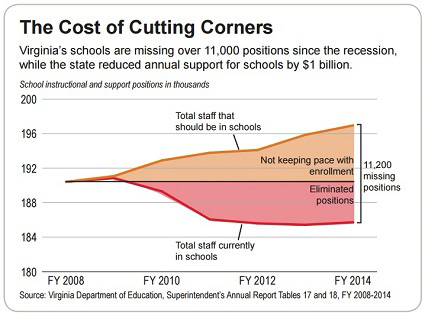
Cash-strapped school districts across Virginia cut teaching and staff positions and crammed more students into classrooms during the Great Recession, as state and local funding fell off, leaving them with a huge deficit of teachers, according to a new report.
The Commonwealth Institute concluded that Virginia schools are now “missing” 11,200 staff members, including 4,600 teachers. That’s the number of additional staff members and teachers that would be working in Virginia schools if hiring had kept pace with student enrollment through the recession, when Virginia schools added more than 42,000 students to their rolls.
At the same time, the state has seen growth in the number of students who often need additional support. The report found a 39 percent rise in the number of students who are economically disadvantaged and a 33 percent increase in the number of students who enter school learning English. The homeless student population is up 73 percent, according to the institute’s report.
New money available for career and technical education classes
NBC 10 (WSLS)
November 12, 2015
Virginia Western is one of six community colleges in the Commonwealth chosen for a new grant that will allow students to take career and technical education classes. A Virginia Western spokesperson says students can’t get federal financial aid for these types of courses so this will help fills some gaps.
Students don’t have to pay the money back. Money has to be used for in demand careers that lead to industry recognized Credentials or licenses that can be used in our area like a Commercial Driver’s License, Industrial Maintenance, Pharmacy Technician, Basic Manufacturing, Welding, Certified Nursing Assistant.
The pilot program includes $200,000. Virginia Western hopes to help 144 students. Blue Ridge Community College and Patrick Henry Community College also got a similar grant for the program.
Virginia lawmakers look at virtual classroom options
The Daily Progress
November 10, 2015
The funding trend for virtual education is moving toward a performance-based model, one that means students must successfully complete the course, an expert told state legislators Tuesday.
The online method of teaching students now includes 30 states, and five — including Virginia — require that a student completes at least one online course before graduation.
Florida is one state requiring performance-based funding, according to Wanda Barker, the director of the educational technology cooperative for the Southern Regional Education Board. She said Florida has the largest K-12 virtual enrollment.
|
| National Education News |
|
ACT Introduces New STEM College Readiness Benchmark; Results Reveal Limited Readiness for College STEM Coursework
ACT
November 11, 2015
Relatively few STEM-interested students are well prepared to succeed in college STEM courses, according to The Condition of STEM 2015, released today by ACT.
The report shows that only 26 percent of ACT-tested 2015 graduates who were interested in STEM met or surpassed the new ACT STEM College Readiness Benchmark. The benchmark, which makes its debut in this report, is an indicator of whether a student is well prepared for the types of first-year college courses required for a college STEM-related major.
“These findings confirm the conclusions we drew from our Condition of College & Career Readiness 2015 report—namely, that the country needs to take strong, urgent action to avoid a looming crisis in college and career readiness,” said Marten Roorda, ACT chief executive officer. “This is especially troubling in the important area of STEM, which has a growing impact on the nation’s competitiveness in the global economy.”
Where the 2016 Democratic candidates stand on college affordability
CBS News
November 14, 2015
The total student loan debt held by Americans is estimated to be over $1.3 trillion dollars, surpassing even total credit card debt as the largest source of household debt in the country.
To make matters worse, the average cost of a college education has risen sharply in recent years, thanks in large part to the state budget crunches that followed the recession and the 2008 financial crisis. The numbers are striking: A report earlier this year from the left-leaning Center on Budget and Policy Priorities found that average annual tuition at public colleges and universities in the U.S. increased by 29 percent between 2008 and 2015. Some states saw tuition increases of over 60 percent.
The Democrats running for president - Hillary Clinton, Bernie Sanders, and Martin O'Malley - have argued that the soaring cost of a college education not only drags on the economy by forcing young workers to pay off debt instead of consuming, it also betrays the American dream by pushing a college degree out of reach for the less affluent.
THE $10-BILLION SPORTS TAB: How College Students Are Funding the Athletics Arms Race
Chronicle of Higher Education
November 15, 2015
Deep within the stadium, the team gathered for a college football ritual. The marching band gave its cue, and the players bounded through a long tunnel, a blue-and-white blur, pumping fists and high-fiving students who had gathered to cheer.
For a few moments, it was possible to believe that the team’s enthusiasm would be met by the roar of spectators and the full pageantry of game day in the Deep South. But then the tunnel ended and the team, the Georgia State Panthers, emerged into the largely empty 70,000-seat Georgia Dome, home of the NFL’s Atlanta Falcons.
An announced crowd of 10,252, clustered at midfield, clapped politely. But a few minutes after kickoff of this season-opening game, after the home team had fumbled the ball on its opening possession, all the energy had left the building.
The Panthers, now in their sixth season, haven’t given fans much reason to celebrate. In the 2013 and 2014 seasons, competing at the highest level of the National Collegiate Athletic Association, the team recorded just a single victory. Average attendance last year was among the 10 worst in the NCAA’s top level. Yet Georgia State’s 32,000 students are still required to cover much of the cost. Over the past five years, students have paid nearly $90 million in mandatory athletic fees to support football and other intercollegiate athletics — one of the highest contributions in the country.
A river of cash is flowing into college sports, financing a spending spree among elite universities that has sent coaches’ salaries soaring and spurred new discussions about whether athletes should be paid. But most of that revenue is going to a handful of elite sports programs, leaving colleges like Georgia State to rely heavily on students to finance their athletic ambitions.
Research Group Seeks More Influence Over Policy, Practice
Education Week
November 17, 2015
At the end of a keynote discussion on assessment at the National Academy of Education’s 50th anniversary meeting here—full of passionate arguments on how policymakers misuse test scores and the need for more formative assessment—John Q. Easton stood to ask what was immediately dubbed “the most depressing question of the day.”
“Many of the points that have been brought up today, we’ve been hearing for eight, 10, 12 years. ... We’ve talked about them for a long time but nobody pays any attention to us,” he lamented at the conference earlier this month. “Why do we have so little influence, so little ability to communicate with those practitioners and policymakers?”
The question—coming from a former director of the Institute of Education Sciences and a distinguished senior fellow at the Chicago-based Spencer Foundation, one of the academy’s chief sponsors—cut to the heart of the organization’s current soul-searching over its place in the education policy landscape.
|
|
Have Teacher to Student Ratios Fallen in Virginia?
A week ago, the
Commonwealth Institute (no relationship to CEPI), an independent group with a focus on the economic issues facing low- and moderate-income residents of Virginia,
released a report on educational staffing in Virginia which concluded that over 11,000 instructional positions are missing from Virginia schools because the recent recession took a bite out of school budgets at the same time enrollment increased. The report, titled "
Missing Class," arrived at the number by calculating the difference between FYE 2014 instructional positions across the commonwealth and the number that would have existed if the instructional position per 1,000 student ratio had remained steady from it's FYE 2008 level of 105.74 (in FYE 2014 the ratio had dropped to 101.06). The chart below, copied from their report, highlights this gap.
Several news media picked up on the report, including the
Washington Post, the
Richmond Times-Dispatch and the
Roanoke Times. Here at the Commonwealth Educational Policy Institute, we were curious to see what the variation looked like across school systems. Had instructional positions declined relative to student population across the board?
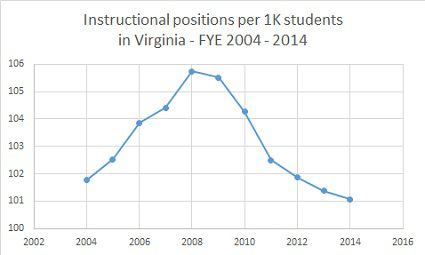
Before we show that variation, we want to mention an observation we noted when we compared the same change over the last decade, a time frame we selected because JLARC recently issued
a report that looked at K-12 spending over a similar period. As you can see from the chart below, the "Missing Class" report chose the high point in instructional staff to student ratio as their reference point. Our quick skim through the media reports listed above saw no mention of this, however, we believe it's an interesting point.
 |
|
The Virginia Dept. of Education posts the same ratio going back to FYE 2002 and this is reported each year in the Superintendent's report, Table 17. So, while the 11,000 missing positions is a striking number, it's calculated from a high watermark. Were you to perform the same analysis using the FYE 2004 ratio as your base, the number of missing positions across the state would be approximately 879 rather than 11,000. No doubt those wanting to make an argument for greater educational funding will argue for the 2008 baseline while those who want to hold education funding steady would opt for a different baseline. Our point is not to argue for one or the other, but to address the impact of the choice for subsequent analysis.
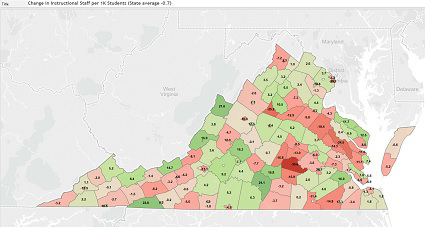
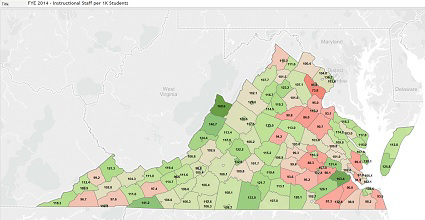
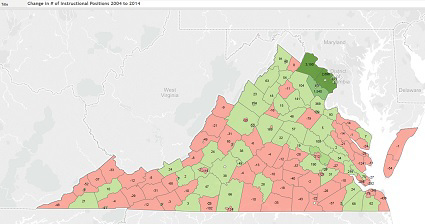
Let's return, then, to our original question. What does the variation look like across school systems? A first way of looking at this is to map the instructional staff per 1000 students ratio (the measure used by VDOE) for the most recent year available, across the various school systems. The highest ratio (169.6) is in tiny Highland County (ADM of 206). The lowest is Prince William County at 73.77 while the state average in that year was 101.6. (In the map, systems shaded green are above that state average, red are below).
 |
|
But what about the change from the past? Has there been an absolute decline in instructional positions? Across the state, no. Compared to FYE 2004, there were 8,689 more instructional positions in the state in 2014. But there was variation by system. Fairfax and Loudoun County systems alone added almost 6,000 positions in order to keep up, respectively, with a 76.3% and 13.7% growth in ADM over that period. Many other school systems saw the absolute number of positions decline (all the red in the map below). But many of these school systems were losing student population over the period.
 |
|
It's more appropriate to make a comparison of the instructional staff to student ratio. Relative to the FYE 2004, there was a slight state-wide decline from 101.76 to 101.06, a loss of .7 instructional positions per 1000 students. But the map below shows that this varied widely by school system. Amelia County lost nearly 40 instructional staff per 1000 students over the period, the top drop in the state. Alexandria also saw a large drop of 29.1 staff per 1000 students. Charlotte County saw its ratio rise by 24.1 staff per 1000 students, but this was likely due to stable staffing as the system lost more than 9% of its enrollment over the decade. (Please look at these and several other
maps in detail here.)
The story, then, is more complicated than an across the board drop. Some school systems have increased staff relative to their student populations while others have seen declines. Fairfax, Loudoun and Henrico counties are all large school systems where signficant growth has been met with increased resources and an increased ratio of instructional staff to students over the last decade. However more concerning are many of the rest of the large schools systems in more urban areas. Arlington, Alexandria, Richmond City, Hampton, Norfolk and Newport News have all seen ratios of instructional staff to students decline over that period.
Though these changes hopefully provide food for thought for many of our readers, its safe to say that school funding will again be a hotly contested item in the coming General Assembly. Our
Poll Snapshot this week looks at information from
our 2015 Commonwealth Education Poll that examined several school funding questions and we look forward to asking many of these same questions in our 2016 poll, which will be released as the General Assembly comes into session in January. Read below for more detail, but here's the headline - a slight majority would be willing to pay more in taxes to have higher K-12 education funding.
We also include an excerpt from
Dr. Vacca's recent newsletter looking at teacher contracts - one of the largest chunks in any school system's budget.
Finally, a couple words of thanksgiving. In honor of the time off for the holiday next week, we won't be publishing an issue of Compass Point on Nov. 25.
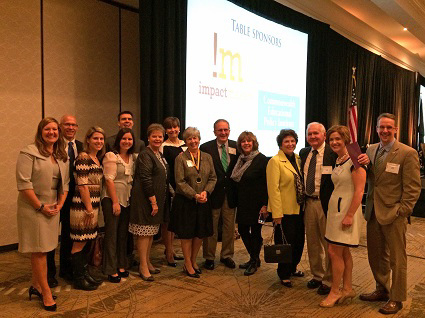
We are also very thankful for the opportunity last Friday to gather CEPI staff past and present (see above) at the Excellence in Virginia Government Awards as our founder, Dr. Bill Bosher, was honored posthumously for his long career of service. Pictured are staff and several members of Dr. Bosher's family.
We wish you a wonderful opportunity to gather with your family over the holidays.
Sincerely,
CEPI
|
Poll Snapshot: School Funding
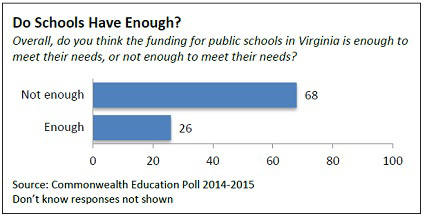
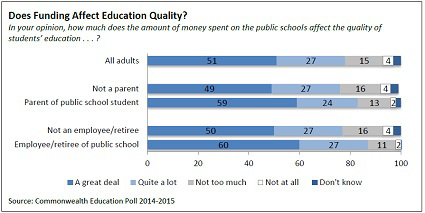
The public would likely be pleased with any efforts by the state and localities to increase teacher pay and other funding for education. Virginians remain strongly supportive of funding for the public schools and see it as having a direct impact on school quality. In early 2015, more than two-thirds of Virginians (68%) said that Virginia schools do not have enough funds to meet their needs, while only 26% felt schools have enough funding now.
More than three-quarters of respondents (78%) also said that the amount of funding affects the quality of schools a great deal or quite a lot. School employees/retirees (at 60%) and parents of public school students (at 59%) were more likely to say funding mattered a great deal when compared to non-employee/retiree (50%) and non-parent respondents (49%). Likewise, 58% of minorities said funding mattered a great deal compared to 48% of whites.
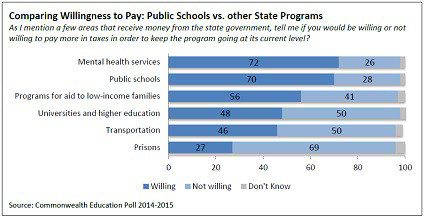
Most Virginians are willing to pay more in taxes to support school funding levels. Seven-in-ten respondents (70%) said they would be willing to pay more in taxes to keep public schools funded at the current level and 53% are willing to pay more so that school funding can be increased. Of those willing to pay more to increase funding for public schools, 44% favored a sales tax as the best vehicle for a tax increase while 22% preferred an increased income tax.
Larger proportions of Virginians are willing to pay more in taxes to protect funding for public schools (70%) and mental health services (72%) than would do so to keep programs for aid to low-income families (56%), funding for higher education (48%) and transportation (46%) at current levels. Only about a quarter of state residents (27%) are willing to pay more to keep funding for prisons at current levels.
To read the full results of the poll, visit our
website.
|
Education Law Newsletter - Teacher Contracts
Excerpted from Dr. Vacca's
February 2015 Newsletter
"As communities across this country continue to expect and insist that their local school boards do infinite things with a finite (in some cases even shrinking) budget, and as local community demographics rapidly change and student enrollments become more culturally diverse, being creative and flexible regarding personnel (including full-time teachers) is needed. Past solutions for past problems might not work in solving the emerging problems found in today’s rapidly changing, data-driven, social and fiscal environments. One area of close scrutiny by local school boards in dealing with today’s changing scene, where long term fiscal commitments are risky, involves classroom teacher contracts.
Emerging Fiscal Issues and Contractual Flexibility. In today’s public school systems, while the recruitment, selection, and hiring of new classroom teachers remains a critical part of the task, assigning and reassigning existing teachers (including those possessing tenure status), and shifting fiscal resources from one school to another (especially from “high performing schools” to “struggling schools”), and from one subject area to another, are of critical importance and have a direct impact on policy. As local school boards work to bolster student academic progress and performance is it necessary to eliminate extra-curricular activities including sports teams, or reduce the emphasis on some academic areas while building up others? As a need to expand mathematics and computer science courses grows, what is the future of art, drama, music, physical education, culinary arts? Will it be necessary to increase school system budgets to support growing numbers of immigrant and English language learning children entering the schools? How do we continue to adequately fund special education?
Should local school boards pay teachers and other employees strictly on a “pay for performance” model? In an effort to save money on such matters as health care and retirement is it necessary to fill vacant positions with temporary and part-time workers and reduce the number of full-time employees (including classroom teachers)? In a local public school system in the area where I live the superintendent has proposed to his board that to improve student academic performance classroom teacher pay be tied to days worked—i.e., paying teachers for their work. (B2, Richmond Times-Dispatch, February 4, 2015)
Policy Implications
In today’s tight fiscal environment, as local public school boards deal with rapid political, cultural, and social change; work to diligently carry out federal and state legal mandates; and continue to meet the rising expectations of their communities, coming up with creative solutions to budgetary issues has become a daily fact of life. Because of escalating costs (e.g., health care) and limited fiscal (property tax dependent) resources, state-wide student academic requirements, and shifting student enrollments, the one area of school system operation that has and continues to receive the most attention and scrutiny is personnel—the largest single category in the total school system maintenance and operation budget where flexibility, creativity, and change are often trumped by collective bargaining agreements and traditional notions of tenure and seniority.
While recognizing that Mirabilio v Regional School District 16 (2nd Cir 2014) is but one court decision from one jurisdiction, my intent in presenting the case is twofold. First, to offer an example of how one local school board tried to limit the working hours and reduce the salary within a new full-time contract issued to a returning tenured teacher, while not being in violation of the state tenure law. Second, to present the factual analysis and rationale of the United States Court of Appeals for the Second Circuit as the Court dealt with issues of “termination” and procedural due process. Especially informative in clarifying the potential legal and policy issues in the case is the dissenting opinion written by Judge Calabresi. Potential policy implications gleaned from the Second Circuit Court’s majority and dissenting opinions are as follows:
In matters of teacher employment contracts, local school board policies must make it clear that:
- The intent of the Board is to honor and implement the substantive and procedural mandates of all collective bargaining agreements, where they exist, and state teacher tenure statutes in jurisdictions where they exist and in situations where they are applicable.
- Where the Board decides to terminate the contract of a teacher all procedural requirements specified in state law and Board policy will be followed.
- The Board is vested with discretionary authority to assign and reassign all teachers (full-time and part-time) to schools, teaching positions, combinations of positions, and school-related extra-curricular activities for which they are qualified and where the needs of the school system require such assignments and re-assignments.
- All contract changes will be communicated to employees as soon as practicable.
- Teachers (full-time and part-time) are expected to: (a) fulfill all work-related duties and tasks associated with their teaching position, (b) work within the official hourly schedule and (c) carry out all contractual obligations at a salary set by the Board—as specified in the employment contract."
|
|