 |
| State & Local Education News |
|
Alexandria school targeted students before SOL testing
Richmond.com
September 11, 2016
As schools were busy readying students for state exams, teachers at Cora Kelly School for Math, Science and Technology, a high-poverty school in Alexandria, were poring over data to determine which students would probably not do well on the tests.
But according to a school district investigation, the effort wasn’t aimed at giving those students extra help. Instead, Principal Brandon Davis allegedly told teachers this spring to call the parents of students who appeared on the brink of failing the exams to inform them of their right to opt out of the tests, according to the investigation. Over three dozen parents decided to pull their children from the state Standards of Learning exams; no parents at the school had done so the previous year.
Virginia Tech email threat came from outside U.S., officials say
The Washington Post
September 11, 2016
Threatening emails that caused concern last month on the Virginia Tech campus originated in South America, authorities said.
In a statement issued Friday afternoon, the Virginia Tech campus police department said it “has been able to identify that the threatening emals originated from a South American country.”
Neither the country nor any individual sender was identified in the statement.
The department said federal and foreign authorities “have now assumed primary roles in the investigation.” It said both had already been involved in the probe.
Virginia schools served 4.88 million more breakfasts to neediest students last school year than year prior
Richmond.com
September 7, 2016
Virginia schools served nearly 5 million more breakfasts last school year as a result of a statewide effort to cut down on the number of children going hungry.
The increase was due largely to an additional $537,000 in funding this past school year that went toward expanding programs geared toward making breakfast available to students, particularly those from low-income households.
With the additional meals, 59 percent of the state’s 408,000 low-income students who receive a free or reduced-price lunch were provided breakfast at school. That’s up about 8 percent from the number of student who did three school years ago.
“When I first came into office, half of all Virginia students who rely on school meals missed out on breakfast each day,” Gov. Terry McAuliffe said. |
National & Federal Education News
|
Report: Benchmark led to special education services denials in Texas
FOX News US
September 12, 2016
HOUSTON – More than a dozen teachers and administrators from across Texas say they delayed or denied special education to disabled students in order to stay below the benchmark state officials set for the number of students who should get such services.
A Houston Chronicle investigation found the Texas Education Agency's enrollment benchmark for special education services of 8.5 percent has led to the systematic denial of services by school districts. In the years since Texas' 2004 implementation of the benchmark, the rate of students getting special education dropped from near the national average of 13 percent to the lowest in the country. It fell to 8.5 percent in 2015.
If Texas provided services at the same rate as the rest of the U.S., 250,000 more kids would be getting services such as therapy, counseling and one-on-one tutoring. The newspaper said records show Texas is the only state to set such a benchmark, which was never publicly announced or explained.
Apple Offers Free App to Teach Children Coding (iPads Sold Separately)
New York Times
September 12, 2016
Apple plans to release a free coding education app on Tuesday that it developed with middle-school students in mind, in the latest salvo among technology companies to gain share in the education market and to nurture early product loyalty among children.
Apple’s app, called Swift Playgrounds, introduces basic computer programming concepts, like sequencing logic, by asking students to use word commands to move cartoon avatars through a fanciful, animated world. Unlike some children’s apps, which employ drag-and-drop blocks to teach coding, the Apple program uses Swift, a professional programming language that the company introduced in 2014.
“When you learn to code with Swift Playgrounds, you are learning the same language used by professional developers,” Brian Croll, Apple’s vice president of product marketing, said in a telephone interview. “It’s easy to take the next step and learn to write a real app.”
Washington Post
September 12, 2016
Tests taken. Test scores. Graduation rates. These are the central data points for most high school rankings. But now there is something new — and very different.
Everybody knows about U.S. News & World Report’s famous college rankings, but they also rank high schools, based largely on standardized test scores as well as graduation rates. Washington Post education writer Jay Mathews does his long-standing “Challenge Index” rankings based not on test scores themselves but on a percentage of students in a school who took Advanced Placement, International Baccalaureate or Advanced International Certificate of Education tests.
But now there is a high school honors list that has a different set of priorities. It’s the Schools of Opportunity, a project launched by educators who wanted to highlight public high schools that actively seek to close opportunity gaps through 11 research-proven practices and not test scores, which are more a measure of socio-economic status than anything else.
|
|
|
In a democracy, what is the success rate on the Social Science and Writing SOL?
Over the past several weeks, we reviewed the SOL scores for the 2015-16 school year in reading, math and science, all released last month by the Virginia Department of Education (VDOE).
This week we take a look at the remaining two areas of the SOL testing - Social Sciences and English Writing, again visualizing overall performance but also the variation between school divisions.
Last week we also noted that science and math skills are often seen as critical for today's job market. However, knowledge of how our society has functioned through history and a basic understanding of civics and economics are arguably critical skills for citizens in a democracy. Moreover, the ability to express perspectives clearly in writing is not only a helpful job skill, but also a longstanding part of our public discourse as a democracy. As the nation increasingly turns its attention to the elections this November, how are schools doing at covering these critical skills for our democracy?
As we look at these results, it's helpful to recall that Social Studies tests cover a range of topics from geography to world, U.S. and Virginia history as well as economics. You can check out
the SOL frameworks for each area or review
past test questions. (Recall, the state accredits individual schools against a pass rate benchmark of 70 on Social Science tests and 75 on English Writing.)
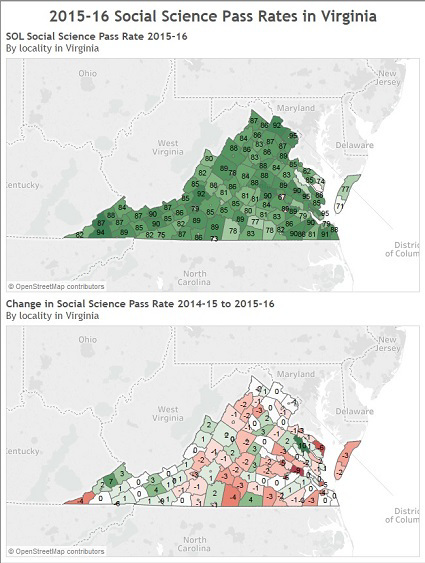
The maps below give a quick visual sense of which school systems were above the benchmark (those in green) and which were below (those in red) as well as what the change was from the prior year to 2015-16. The darker the shade, the further from the breakpoint the pass rate was. Click on each map or
here for English Writing and
here for Social Science to see an interactive version on Tableau Public.
 |
| Data accessed from Virginia Department of Education at http://www.doe.virginia.gov/statistics_reports/school_report_card/index.shtml |
For social sciences, we can quickly see that school systems are almost universally exceeding the benchmark pass rate. The few exceptions are urban school districts that face significant challenges across the board (e.g. Richmond City, Petersburg City).
Regarding the question of improvement the lower map shows a much more mixed pattern. In looking at this change map, it's helpful to remember that small variations in pass rates may be due to random factors that aren't connected to teaching.
 |
| Data accessed from Virginia Department of Education at http://www.doe.virginia.gov/statistics_reports/school_report_card/index.shtml |
For writing, however, the results are more concerning. School systems falling below the writing benchmark of a 75% pass rate are spread across the state, with some school systems missing the benchmark by as much as 20-30 points.
Change from the prior year is again not very positive, with half a dozen systems seeing drops in their pass rate of 8 to 15 points with smaller drops scattered geographically. But there are also examples of positive shifts with Highland County showing a double digit improvement.
We hope you find these maps interesting and helpful. Next week we look forward to reviewing the actual accreditation report on individual schools that are due out soon from Virginia Department of Education.
Finally, because we've discussed how well K-12 schools have been doing (as measured by SOL pass rates), we thought we'd review what the public thinks about how well Virginia institutions of higher education are doing. We share
below the results of our most recent Commonwealth Education Poll which asked people whether they thought colleges and universities are doing a good job on such things as equipping students with communication skills.
We hope you have a great week!
Sincerely,
CEPI
|
CEPI Poll Snapshots - Evaluating the Performance of Higher Education
Drawn from our 2015-16
Commonwealth Education Poll.
(The margin of error for the poll is ± 4.2 percentage points.)
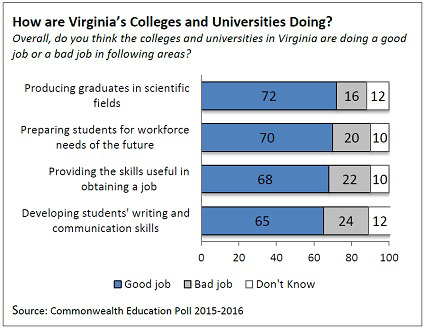
Higher education is also a key player in developing a competitive workforce and equipping students for success in a career. When it comes to specific outcomes, strong majorities say Virginia colleges and universities are doing a good job in four critical areas related to workforce development. Seventy-two (72%) percent of Virginians say colleges and universities are doing a good job in producing graduates in scientific fields and 70% said the same about preparing students for the workforce needs for the future. Sixty-eight (68%) percent say the state schools do a good job providing the skills that will be useful in obtaining a job. A slightly smaller majority (65%) thinks they are doing a good job developing students’ writing and communication skills.
Public opinion on these factors is either steady or trending slightly upward over the last five years in which the Commonwealth Education Poll has asked the question. All of the variation is within the poll’s margin of error.
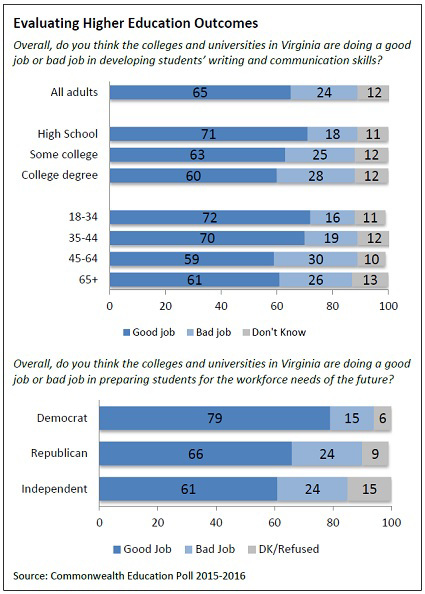
Different age groups evaluated higher education outcomes somewhat differently. Respondents in the 18-34 and 35-44 year-old groups were significantly more positive about the performance of colleges and universities in the area of developing students’ writing and communication skills (72% and 70% respectively said colleges were doing a good job). Older age groups were less likely to say the same, where only 59% of respondents in the 45-64 year-old group and 61% of the 65 or older group felt colleges were doing a good job.
Relative to the same outcome area of communication/writing skills, there was also a difference in perspective among those with college experience. Those with a college degree or more (60%) and those with some college (63%) were less likely to say colleges were doing a good job. This compared to 71% of respondents with a high school diploma or less who said the same.
In the area of preparing students for the workforce needs of the future, there was a significant difference in perspective based on partisan identity. Almost eight in 10 Democrats (79%) felt colleges were doing a good job, compared to 66% of Republicans and 61% of Independents. Those aged 35-44 (at 60%) were less likely to say the same, compared to those aged 18-34 (72%), 45-64 (75%) or 65 or older (72%).
(To read the full poll, visit our
website.)
|
|