 |
| State & Local Education News |
Landes introduces higher-education reform bills
Augusta Free Press
September 5, 2016
Phoebe Willis, a current student of the University of Virginia Law School feels impacted by the rising cost of higher education. She is currently the student representative on the University of Virginia Board of Visitors.
She explains that she witnessed the increase of this cost nationwide. Willis states that it is hard to keep up with the rising cost. For her, it does not matter which school because enrolling in a four year course in a university or college brings a financial burden to anyone.
"I understand the privilege of attending the University of Virginia, which provides a first-class education at a fraction of the cost of its peer group colleges and universities," Willis says to Roanoke.
Interview: Gloucester teen at center of transgender bathroom fight
Richmond Times Dispatch
September 5, 2016
RICHMOND, Va. (AP) — College applications and high school graduation are the biggest worries for most 17-year-olds. For Gavin Grimm, it's waiting for the nation's highest court to decide whether he can use the boys restroom.
Grimm, who was born female but identifies as male, heads back to Gloucester High School for his senior year this week as the U.S. Supreme Court considers whether to intervene in his case that challenges the county school's policy barring him from using the bathroom of his choice.
For now, Grimm will have to continue using a private single-stall restroom or a bathroom in the nurse's office. The 4th U.S. Circuit Court of Appeals sided in April with Grimm, but the Supreme Court recently ruled that the school board can keep him out of the boys restroom at least until the justices decide whether to hear the school board's appeal.
Va education officials moving forward with plans that could transform how schools work
Richmond Times Dispatch
September 4, 2016
Later this month, Virginia’s Board of Education will get its first look at the draft of a plan being created to change graduation standards across the state, an effort aimed at better preparing students for new workforce realities.
The draft, which is scheduled to be presented at the board’s Sept. 22 meeting, is a major step in a process that is expected to change how high schools prepare the graduates who will enter as freshmen in 2018.
Changing these standards is part of a much larger state and federal effort to reimagine education, one that includes transforming how students are assessed, how schools are evaluated and how high schools function. |
National & Federal Education News
|
At Emsworth academy, education, spirituality, geared toward 21st-century challenges
Pittsburgh Post-Gazette
September 5, 2016
The day before their official start of school last week, uniform-clad students at Holy Family Academy spent part of Thursday morning swinging mallets, turning wrenches and carrying lumber as they assembled desks and laboratory tables that they’ll be using in the coming year.
All that pounding gave way to the hushed atmosphere of the school chapel where they gathered later in morning, as spiritual director David DiMichele asked them to sit quietly and listen to the musical prelude. “I can’t think of a more peaceful place than God’s house,” he said.
This combination of hands-on education in a spiritual setting makes up the model for the Emsworth academy, now in its third year after being launched against the headwinds of declining Catholic-school enrollment locally and nationally.
Augmenting the reality of ecology education
Plos Blogs
September 5 2016
To prep for an Ecology 101 field trip, you might tell your students to strap on some hiking boots and grab a waterproof notebook. But how about a fully-charged smartphone? As mobile devices and computer programming become increasingly ubiquitous, many ecologists are unsure whether to welcome or be wary of new technology in the classroom.
One organized session at the Ecological Society of America Annual Meeting posed the question at the heart of this issue: Cyberlearning and Ecology— Inherent paradox or ripe with potential? The session offered a smorgasbord of projects that stunningly integrate mobile devices, programming, and new media into ecology education. These were not designers swept away with the tide of compelling new gadgets; rather, each program or app was grounded in a specific goal in ecology education: increasing access in low-income schools, enabling student inquiry, or incorporating location-specific data.
"Mobile technology is definitely an underutilized tool," says Jere Boudell (Clayton State). "Tech is not a replacement, but an enhancement, a new way to engage people."
Washington Post
September 4, 2016
It’s bad enough that students are required to take high-stakes standardized tests that are often poorly designed and administered, don’t assess what kids have learned, and have “cut scores” deliberately set high so few students can get top scores. What’s more, some of these K-12 “accountability” tests have no consequences for the kids but high stakes for their teachers and schools.
And now there is something new that can skew a classroom’s and school’s results: kids who deliberately do poorly either because they know they have no personal stake in it or because they are protesting the tests. If you don’t think this dynamic is real or important, take a look at what just happened at a leading high school in Washington.
|
|
|
In at STEM trending economy, how do Math and Science SOL pass rates look?
Happy Labor Day and we hope the first day of school went smoothly for those school systems who started yesterday!
Last week we reviewed the reading SOL scores for the 2015-16 school year, released last month by the Virginia Department of Education (VDOE).
This week we take a look at SOL scores for the areas of Science and Math, again visualizing overall performance but also the variation between school divisions.
Proficiency in science and math is often highlighted as essential for the growing number of jobs within the Science, Technology, Engineering and Mathematics (STEM) sector. Chmura Economics & Analytics put out
this blog report on the growth of STEM positions relative to others back in February, showing that from 2005-2015, STEM jobs grew 9.8% while non-STEM jobs grew at only a 4.5% rate. That differential is projected to stay roughly the same - from 2015-2025 the STEM growth rate is projected to be 10.1% while the non-STEM is projected to be 6.5%. (For a more detailed look at what falls within the STEM field and where that sector is going, check out this
2014 U.S. Bureau of Labor report).
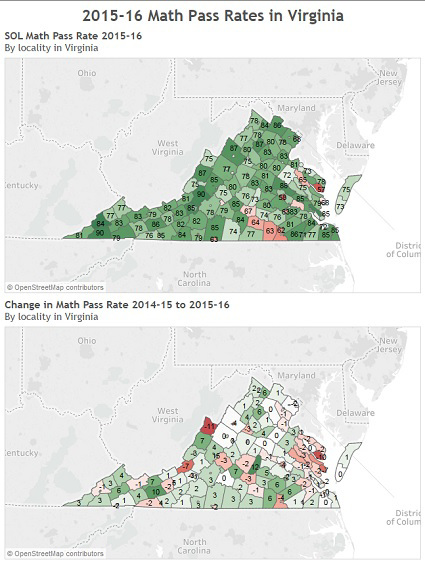
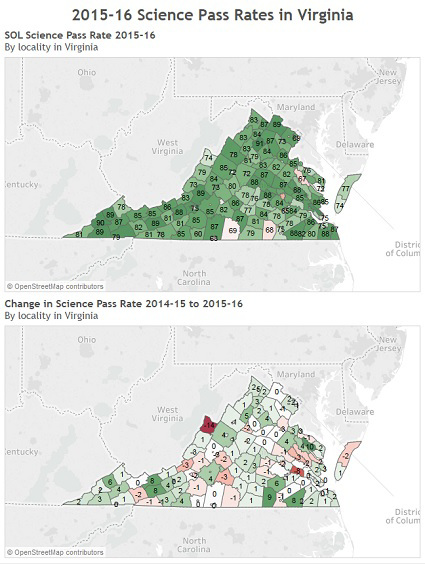
So if science and math skills are critical for today's job market, how are Virginia school systems doing according to the SOLs? (Recall, the state accredits individual schools against a pass rate benchmark of 70 on Science and Math tests.) The maps below give a quick visual sense of which school systems were above the benchmark (those in green) and which were below (those in red) as well as what the change was from the prior year to 2015-16. The darker the shade, the further from the breakpoint of 70 the pass rate was. Click on each map or
here for Math and
here for Science to see an interactive version on Tableau Public.
 |
| Data accessed from Virginia Department of Education at http://www.doe.virginia.gov/statistics_reports/school_report_card/index.shtml |
For math, we can quickly see that the vast majority of school systems are exceeding the benchmark pass rate, with most of the relatively few school systems falling below that benchmark in either urban centers or in the rural areas of South Side.
Regarding the question of improvement the lower map shows a much more mixed pattern. In looking at this change map, it's helpful to remember that small variations in pass rates may be due to random factors that aren't connected to teaching (this
Washington Post article explores one such case). A couple systems posted double digit gains and a couple posted double digit losses compared to the previous year.
 |
| Data accessed from Virginia Department of Education at http://www.doe.virginia.gov/statistics_reports/school_report_card/index.shtml |
For science, the picture is even more positive state-wide, with substantial green areas. Again, most of the systems below the benchmark of a 70% pass rate are urban areas, which often face higher concentrations of poverty and a number of aging school buildings.
Change from the prior year is again scattered. Some schools saw math and science scores go in the same direction (Wythe County, which improved 10 points on Math and 8 on Science stands out in the positive direction.) Other school systems saw one go up and one go down.
We hope you find these maps interesting and helpful. Next week we'll look at scores on Social Studies and Writing.
Finally, given the repeated pattern of SOL scores lagging in urban areas, which often also have concentrations of poverty, we share
below some relevant data from our recent poll which asked people whether they would be willing to pay more in taxes to see funding increased in such high-poverty, low-performing school systems.
We hope you have a great week!
Sincerely,
CEPI
|
CEPI Poll Snapshots - Public Willingness to Pay More Taxes to Help Low-Performing Schools
Drawn from our 2015-16
Commonwealth Education Poll.
(The margin of error for the poll is ± 4.2 percentage points.)
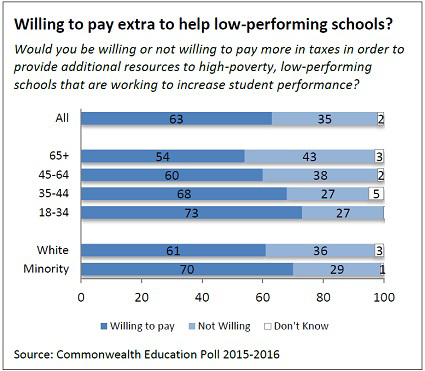
Repeated studies have shown that there are unique challenges to providing high quality education in high-poverty environments. Given that a majority of respondents see SOLs as providing equal standards and accountability to school systems across different types of communities, an interesting follow-up question is whether the public is willing to pay more in taxes in order to provide additional resources to high-poverty, low-performing schools that are working to increase student performance. A majority (63%) of respondents would be willing to pay more in taxes to do so.
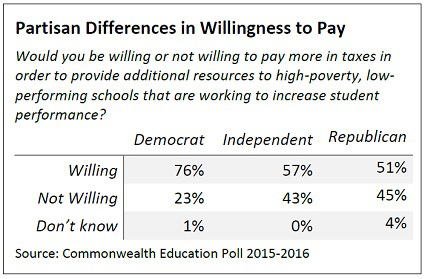
There was significant variability, however, between different demographic groups. Younger respondents were more likely to support additional resources for high-poverty, low-performing schools. Among 18-34 year-olds, almost three-quarters (73%) were willing to pay more in taxes, while that proportion dropped to 68% among 35-44 year-olds, 60% among 45-64 year-olds and 54% among those 65 or older. Likewise, minority respondents (70%) and Democrats (76%) were more likely than whites (61%) and Independents (57%) and Republicans (51%) to be willing to pay more in taxes to increase resources flowing to high-poverty, low-performing schools.
(To read the full poll, visit our
website.)
|
|